Free Shipping On world wide
- HOME
- PRODUCTS
- IN THE NEWS
- SPECTRUM BLOG
- WEB SPECTRUM VIEWER
-
English
-
USD
Free Shipping On world wide
(DA No. 24-183). Public Notice announcing that certain Auction 108 licenses are granted.
On July 11, 2019, the FCC released a report and order that provided a pathway to commercial ownership of the 2.5GHz Educational Broadcast Service (EBS) channels that were previously reserved for educational groups. In this post, I am going to examine the progress that T-Mobile has made in shifting from leasing this spectrum to owning it.
We will be looking at two trends, using historical data from Spektrum Metric's Mobile Carrier - Spectrum Ownership Analysis Tool. The Mobile Carrier - Spectrum Ownership Analysis Tool is updated monthly and provides historical analysis going back to 2014.
Looking at our Spectrum Ownership Grid in the Web Spectrum Viewer, T-Mobile's control of the EBS spectrum is clearly seen. This is our Spectrum Grid displaying "Future" data which includes spectrum that T-Mobile leases or has a pending transaction filed.
Spectrum Grid - Future:

Shifting to the Spectrum Ownership Grid to display the spectrum licensee "FCC" reveals the licenses that T-Mobile actually owns. All of the white cells are educational licenses that likely lease their spectrum to T-Mobile.
Spectrum Grid - FCC:

National Weighted Spectrum Depth Trend:
The spectrum available in the EBS and BRS (Broadband Radio Service) bands for each county totals 194 MHz. If T-Mobile controlled every license in every county their National Population Weighted Average spectrum depth in the 2.5 GHz band would be 194 MHz, thus any amount of below 194 MHz represents another licensees ownership or lease of spectrum in these bands.
After the EBS Auction was completed, T-Mobile's total 2.5 GHz spectrum (orange line) rose from roughly 164 MHz to 180 MHz, indicating that about 14 MHz of Nationally Weighted Spectrum is controlled by other carriers and licensees. The spike in September 2022 indicates the release of the auction results.
Over the same time period we quantified the spectrum that was directly owned by T-mobile (blue line). Note: The EBS Auction results are not reflected in this trend line because T-Mobile has not received direct ownership of the licenses. In the December 2010 to June 2023 timeframe, T-Mobile increased their ownership of the EBS spectrum by 11 MHz (National Weighted Population Spectrum Depth).


On December 1, 2022 the FCC began granting the new EBS licenses to the winning bidders from Auction 108. Since many of these licenses are not for complete counties or for the entire auction channel size, I thought it would be useful to see how these licenses appear on the FCC licensing system.
For an example, I have chosen the first auction channel (C1) for Iowa county, Wisconsin, which was purchased by Michigan Wireless.
The map for this license shows all of Iowa county highlighted and all of the C1 frequencies highlighted as well. (If the images are too small to read all of the details, right click on the image and select <Open image in new tab>.

Now looking at the market tab, we will focus on the information at the bottom of the screen. First, all of the 9 component channels (A1, A2, A3, B1, B2, B3, C1, C2, C3) are listed above the county with a full county population value. This would indicate that this license is authorized to cover all 23,687 people living in Iowa county, WI.

Looking back at our outputs from the EBS Whitespace Auction Tool, we can see that representing this license as a complete county license for all of the component channels is not correct.
In our Population Percentage output, it is clear that Michigan Wireless did not purchase the rights to use the B1, B2, and B2 component channels because they were leased to T-Mobile through their lease with the State of Wisconsin -Educational Communications Board. It is also clear that 3% of the county's population cannot be covered with the A1, A2, and A3 component channels.

To see these numbers as raw population values, we will look at our Population output. In this view you can see the population that is licensed for each component channel and the only channels that cover the complete county population are the C1, C2, and C3 channels.

To be accurate, the FCC's market page should be updated to show the actual population available for each channel as seen below:

With the maps updated to show the actual license area for each component channel.
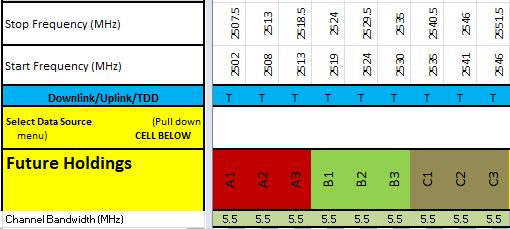
2502.0-2507.5, 2507.5-2513.0, 2513.0-2518.5 MHz (A1,A2,A3):

2518.5-2524.0, 2524.0-2529.5, 2529.5-2535.0 MHz (B1, B2, B3):

2535.0-2540.5, 2540.5-2546.0, 2546.0-2551.5 MHz (C1, C2, C3)

With our May 2022 product releases we have updated our Mobile Carrier Spectrum Database to include the EBS Tribal Licenses that were given priority access to the EBS whitespace. Below we have mapped the existing EBS licenses, the tribal licenses, and the remaining EBS whitespace markets for the EBS A1 channel. As a reminder, the EBS A1 channel is one of 9 channels that make up the 1st EBS Auction Channel (C1) which is 49.5MHz. You can see that there are a significant number of tribal licenses in Alaska, Arizona, New Mexico, and Oklahoma.

Zooming in on Oklahoma, you can see how the tribal licenses have been cut away by the existing EBS licenses.


In our most recent blog post, we highlighted the challenges faced by T-Mobile in two markets where they don't control parts of the EBS spectrum (channels), that limit their deployment of large 5G channels across each urban market. Where that post focused on the effects of owning or not owning a specific channel across a geography, the EBS Spectrum Control Maps below provide a more general look at the percent of EBS spectrum that T-Mobile owns, the FCC owns, and Other Carriers own. To complete this analysis we used the MHz-POPs analysis from our EBS Auction Tool, combined with our analysis of T-Mobile's EBS MHz-POPs using the same geographic licensing database.
While these maps provide insights on the EBS band in totality, the individual issues faced by T-Mobile in Orange County, CA don't strongly appear in these maps because they control all of the EBS channels except the G channels meaning they still control a high percentage of the EBS spectrum in Orange County. For the Chicago market, the whitespace EBS challenges can be seen with Lake County receiving a light green and McHenry receiving an orange.


Recent discussions around the wireless industry have included opining on why T-Mobile acquired 40MHz of C-band spectrum when they control so much 2.5GHz spectrum. Although the 2.5GHz spectrum is a valuable spectrum asset, there are two challenges to this spectrum that are not well understood by the industry and we believe that T-Mobile’s C-band purchases were a strategic purchase to provide a path to overcome these two spectrum licensing limitations.
License Areas Controlled by the FCC:
The first limitation is unlicensed or whitespace areas in core urban markets. To highlight these areas, we are going to start with some whitespace analysis that we have developed as part of our EBS Auction Tool. In this analysis, the percentage of the population that is available in the whitespace area is indicated for each EBS channel in a county. We have also calculated the percentage of the population that is contained with T-Mobile license area and the percentage of the population that is contained within the license area of any other carrier. In the image below we are showing the percentage of the population under T-Mobile’s control and under the FCC control (whitespace) for the entire 2.5GHz frequency band including both the EBS and BRS channels. The color ranges start at 0% with red, 50% with yellow, and 100% with green. In our initial analysis we will be focusing on the first auction channel (black box) in the six counties that make up the Chicago CMA market. We prefer to use the CMA market structure to evaluate urban areas because they include only the most populated counties in each urban area.
2.5GHz Full-band Population Percentage View (Chicago):

2.5GHz – 1st EBS Auction Channel Population Percentage View (Chicago):


In the top section of the chart above, it is apparent that T-Mobile controls all of the 1st EBS Auction channel in Cook, DuPage, and Will counties but they only control all of the A1-A2-A3 channels in Kane County. Fortunately, the parts of 1st EBS Auction channel that they don’t own will be available in the Auction 108. The available whitespace is indicated in the lower half of the chart. Looking at McHenry County, 100% of the C1-C2 channels will be available in the EBS Auction (108).
These charts highlights the percentage of the population available either for T-Mobile’s licenses or for the FCC’s whitespace. Next we will look at the geographic constraints of T-Mobile’s licenses and the shape of each county’s whitespace area. In the map below we are able to show the license areas for the A1-A2-A3 channels because the license areas of interest are identical. It is apparent that T-Mobile has the rights to operate the A1-A2-A3 channels completely across the counties in the Chicago CMA except Lake and McHenry.
Licensing Map – A1-A2-A3 (Chicago):

Looking at the B1-B2-B3 & C3 channels, a whitespace area exists covering almost all of Kane County along with similar whitespace areas in McHenry and Lake counties.
Licensing Map – B1-B2-B3 & C3 (Chicago):

Our final map delineates the largest limitations to the areas that T-Mobile can deploy the C1-C2 channels in the Chicago CMA market. Their base stations located in the gray areas of Kane, Lake, and McHenry counties cannot use the C1-C2 channels.
Licensing Map – C1-C2 (Chicago):
Looking again at the T-Mobile’s control of the 1st EBS auction channel we can highlight the deployment limitations that the whitespace area presents. Since the 1st Auction channel is 49.5MHz, this chart indicates that T-Mobile can deploy roughly a 50MHz channel on any sites in Cook, DuPage, and Will counties. In Kane County they are limited to a 15MHz channel in the available 16.5MHz of spectrum. To have a consistent deployment of a 50MHz channel across Chicago, they would need to purchase the whitespaces areas for each of these channels in each of the Chicago counties.


Looking again at the T-Mobile’s control of the 1st EBS auction channel we can highlight the deployment limitations that the whitespace area presents. Since the 1st Auction channel is 49.5MHz, this chart indicates that T-Mobile can deploy roughly a 50MHz channel on any sites in Cook, DuPage, and Will counties. In Kane County they are limited to a 15MHz channel in the available 16.5MHz of spectrum. To have a consistent deployment of a 50MHz channel across Chicago, they would need to purchase the whitespaces areas for each of these channels in each of the Chicago counties.
The last perspective that we want to share on the Chicago market is the actual population in each of the whitespace areas for each county. Although we thought that 100% of the population was available for each channel in Cook County, the whitespace population table indicates that there is a very small population and small geographic area that is a whitespace within Cook County for the B1-B2-B3-C1-C2-C3 channels.
2.5GHz – 1st EBS Auction Channel Population View - Whitespace (Chicago):

License Areas Controlled by Other Carriers:
The second limitation is spectrum blocks that are controlled by other carriers in core urban markets. To highlight these areas we are going to look at the four counties in the Los Angeles CMA market. For the Population Percentage Chart below, we are including the population percentage for other carriers rather than the whitespace percentages.
2.5GHz Full-band Population Percentage View (Los Angeles):

2.5GHz – 3rd EBS Auction Channel Population Percentage View (Los Angeles):

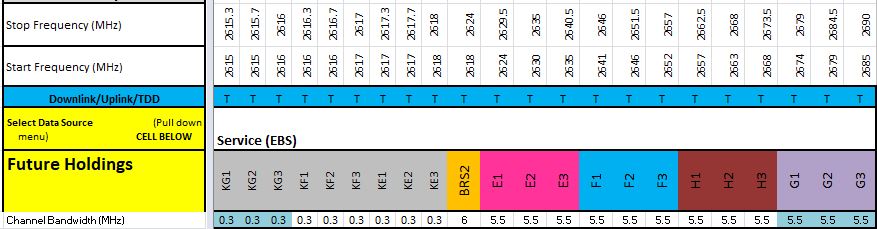
In the Top View it is apparent that T-Mobile already controls the spectrum across all of the BRS channels (gray) in Los Angeles County but they are missing roughly 10% of the population for the G1-G2-G3 channels. In between the two BRS blocks of spectrum are the K guard band channels. The ownership of these guard band channels mirrors the ownership of the primary channel e.g. G1=KG1. The BRS channels and the EBS G1-G2-G3 channels total to 87MHz of spectrum, providing T-Mobile the ability to deploy an 80MHz NR channel throughout most of Los Angeles County. Unfortunately in Orange County, another carrier owns 98% of the G1-G2-G3 channels limiting T-Mobile to a 10MHz channel in the first BRS block (F4-E4) and a 50MHz channel in the second BRS block (BRS2-E123-F123-H123).
Los Angeles CMA Counties:

In looking at the G1-G2-G3 licensing map, you can see that there are actually three licenses that T-Mobile does not control in the Los Angeles CMA Market.
Licensing Map – G1-G2-G3:

2.5GHz – 3rd Auction Channel Population View – Other Carriers (Los Angeles):

The Other Carriers Population percentage view indicates the large licensed population that is controlled by other carriers and would need to be purchased by T-Mobile.
Conclusion:
With these two examples we have shown that missing 2.5GHz spectrum either due to it being unlicensed or being controlled by another carrier present challenges that likely limit T-Mobile’s largest 5G channel size to a subset of each urban market. We believe that T-Mobile’s participation in the C-band and the current 3.45GHz auction was to “future” proof their ability to offer large channel sizes in the upper mid-band spectrum. With either the C-band spectrum or the 3.45GHz spectrum, T-Mobile could use carrier aggregation to achieve 100MHz effective channel sizes even in areas where their 2.5GHz spectrum is more limited.
Today was the cutoff for comments on the EBS Whitespace Auction procedures, so let's take a look at the current status of the EBS Tribal applications, which have a priority on claiming EBS white space. From the chart below, 44% of the applications are still in process. Most concerning are the 83 applications that have been filed but have not seen any action by the FCC. Typically applications are moved to a pending status within a few weeks but these applications have been on file since 3Q - 2020.
| Tribal Applications | Status |
| Filed | 394 |
| Granted | 201 |
| Pending | 92 |
| Dismissed | 18 |
| No Action | 83 |
Below is a map of the granted tribal boundaries overlaid with the EBS A1 channel license areas. Each of these tribal applications has requested access to the first EBS auction channel (49.5MHz). Any tribal areas that extend into these license areas will not have access to the A1 channel (5.5MHz) in the overlap area.

In August, we had blog post that discussed the counties that are on the EBS band plan and the way that the EBS license areas were determined. In this post we are going to examine how to use our EBS Whitespace Auction Opportunities Tool.
The EBS Whitespace Auction Opportunities Tool provides carriers, telephone companies, internet service providers (ISP), cable companies, investors, and financial analysts with the tools to evaluate the opportunities in this auction.
As we discussed before, this auction will provide the winner's access to 3 wide band channels in the EBS (2.5GHz) band. One channels is 49.5 MHz, one channel is 50.5 MHz, and one channel is a combined 17.5 MHz. In the images below, we indicate how each of the existing EBS channels (A1,A2,..) are component channels in the larger wide band EBS Auction channels.
EBS Auction Channel 1:

EBS Auction Channel 2:
EBS Auction Channel 3:

The population that a bidder can serve is determined by the unlicensed population for each of the component channels within each EBS auction channel.
Below is an example of two counties in West Virginia where 100% of the county population is available for each component channel in the EBS Auction Channel 1. In our EBS Whitespace Auction Opportunities Tool this is seen in the Spectrum Grid (% POPs) worksheet. The percentage of the available unlicensed population is divided by the full county population.
Population Percentage Worksheet:

The second worksheet in the EBS Whitespace Auction Opportunities Tool provides the discrete available unlicensed population for each component channel as well as total MHz-POPs for the entire EBS Auction Channel.
Population Worksheet:

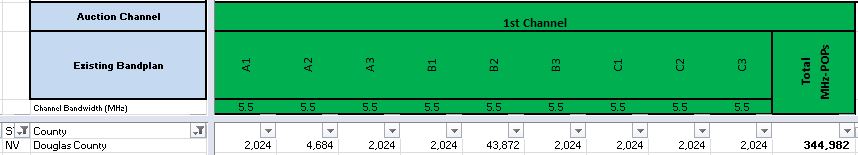
Our next example is a Nevada county that has varying available whitespace population for each component channel. In the POPs view immediately below, the available whitespace population for EBS Auction Channel 1 varies from 2,024 for the A1 component channel to 43,872 for the B2 channel.
Population Worksheet:
In the % POPS view, the population comparison to the total county population is highlighted with Red to Green cell colors. For the A1 component channel, the 2,024 available whitespace POPs represents 4% of the Douglas county population while for the B2 component channel, the 43,872 available whitespace POPs represents 93% of the Douglas county population.
Population Percentage Worksheet:

Available Whitespace Area:
In addition to Population Analysis to each component channel, purchasers of the EBS Whitespace Auction Opportunity Tool also receive access to our EBS Whitespace Mapping module in our Web Spectrum Viewer. Selecting either the A1 component channel cell for POPS or for % POPs, the whitespace license area map for that component channel is displayed.
A1 Component Channel Whitespace Area:

For the B2 component channel the whitespace license area fills a majority of Douglas county reflecting the 92% population availability.
B2 Component Channel Whitespace Area:

The EBS Whitespace Auction Opportunities Tools is available either as a nationwide purchase (all 50 states and US territories) or a state by state purchase. The purchase will enable carriers and investors to evaluate their opportunity to add 2.5GHz spectrum in the targeted markets and it will allow investors to quantity the national or state opportunities for these new channels as well as provide an evaluation of the strength or weakness of the existing 2.5GHz licensee in each market.
The primary challenge in evaluating the EBS Whitespace auction opportunities, lies with the available licensing information provided by FCC. For each of the EBS licenses, the FCC provides a map for a 35 mile radius circle from the license centerpoint. Below is the FCC map for WHR463, an EBS A1 channel license in Los Angeles county. Not indicated in this map, is the overlap that this license has with two other A1 channel licenses in Los Angeles county.
WHR463:

In two images below, it is clear that a significant portion WHR463's 35 mile radius license area is shared with WHG227 and WND634.
WHG227:

WND634:

The FCC resolves these overlap issues through the creation of Geographic Service Areas (GSA) for each license_channel combination. The starting point is to look at all of the 35 mile overlaps on an individual channel basis, e.g. A1, A2, ...
Here is an example case with 5 licenses in a 4 county area.

The Geographic Service Areas are initially created by bisecting each of the overlapping areas (splitting the football) so each license has its own exclusive area.

The GSA's were formed based upon active licenses on a specific date. Licenses that were issued after this date (PSA6) do not claim any part of the overlap area with existing GSAs.

These GSA's are sometimes referred to as "Cookie Bite" GSAs.

After the GSA's were formed, any cancelled or terminated licenses lost their area, but none of that area is added to the GSAs that previously overlapped the cancelled/terminated licenses.

The map below represents the licensed spectrum in this 4 county area, prior to the EBS Whitespace Auction for a specific channel.

The final representation of the unlicensed (whitespace) area in each county that will be available in the auction is the area from the GSA boundary for each license to the county boundary.

Going back to Los Angeles County A1 channel example, you can see the WHG227, WHR463, and WND634 licenses in the center of the map reflecting each of their A1 Channel GSAs.

Our final map indicates the whitespace area for the A1 channel in Los Angeles county. Call signs WHG227 and WND634 were both cancelled after the GSA boundaries were computed, thus their license area is now part of the A1 channel EBS Whitespace, indicated in the orange cross hatch.


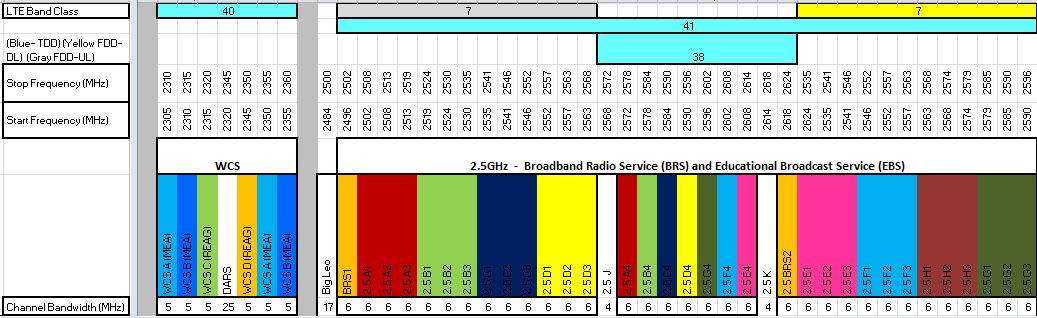
On April 19th, the FCC opened a docket to collect comments related to "Transforming the 2.5 GHz Band". As background, the US 2.5GHz spectrum band encompasses 33 channels. 20 channels (A, B, C, D, and G groups) are designated for Educational Broadcast Service (EBS) and 13 (BRS1/2, E, F, and H) are designated for Broadband Radio Service (BRS).
License Area:
Sprint owns a vast majority of the BRS licenses and leases a vast majority of the EBS licenses. The licensing limitations for this spectrum are drawn from its origins providing broadcast video services. The original licenses were formed as 35 mile radius circles centered on the video transmitting site. When two licenses overlapped, a football shaped area would be formed. A line would be drawn through the end points of the "football" splitting the overlapping license area between the two licensees. BRS licenses include both 35 mile radius licenses, geographic area licenses (entire BTA) and Entire BTA license with cutouts for existing 35 mile radius licenses.
In 2009, a Broadband Radio Service auction (Auction 86) included the remaining unlicensed areas within each BTA for the BRS channels, but the unlicensed area in each BTA for the EBS channels was not auctioned.
Channel Plan Transition:
Prior to this point, Clearwire was launching pre-WiMax networks on the EBS/BRS pre-transition band plan which was designed around video operation. As you can see in the Pre-Transition chart below, the A channels (A1, A2, A3, and A4) are separated by the B channels (B1, B2, B3, and B4). This allowed all of the A channels to be broadcast at a video site without interference. Clearwire would need to control both sets of the "interleaved" channels to have enough contiguous spectrum to launch their RAN network in a market.

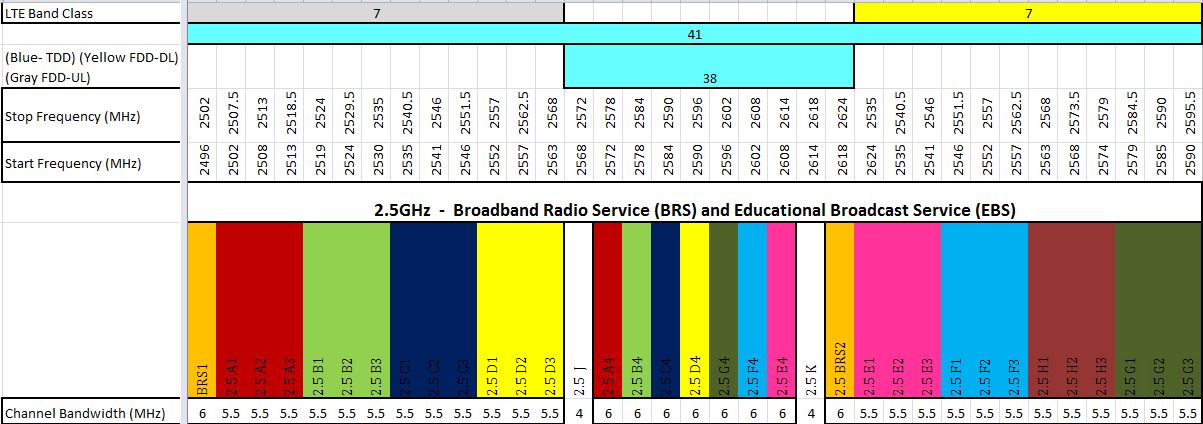
To facilitate data network deployments and to protect the remaining video operations the FCC provided a way to transistion licenses to the Post-Transition band plan on a BTA market basis. If there was a significant commercial video operation in a market, that BTA market was able waived from transition and it stayed with the Pre-Transition band plan. The Post-Transition band plan put the remaining video operators into the mid-band segment (A4, B4, C4, D4, G4, F4, and E4) and provides contiguous spectrum (16.5MHz) for the rest of the channel group (e.g. A1, A2, and A3)
FCC Request for Comments:
License Area:
The FCC has expressed a desire to make the EBS unlicensed area available for use. The FCC has asked whether the expansion of the licenses should include the entirety of the census tracks that license (35 mile) intersects or the entire county that the license intersects. The map below from the National EBS Association (NEBSA) illustrates the counties that would be added to each intersecting EBS license for the A1 channel. For the carriers that already lease these licenses, they would have the opportunity to deploy sites on the larger license area and would likely also pay the licensee a higher monthly payment due to the increase in licensed population. As you can also note below, this approach still leaves all of the white counties unlicensed.

The FCC would like to license the white counties in a 4 step manner:
Service Rules:
The FCC is also proposing to change the service rules for the EBS spectrum to allow the spectrum to be sold to commercial operators rather than requiring leases.
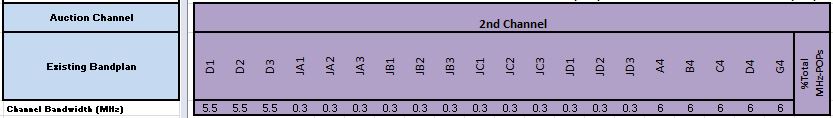
Remaining Pre-transition Markets:
The FCC is also proposing to complete transitioning the remaining pre-transition markets so a consistent band plan would be in use nationwide. A few wireless cable operators had received waivers but most of those operators have ceased operations. This will clear interference issues between markets and facilitate the deployment of data in the Lower Band Segment (A,B,C, and D groups) and the Upper Band Segment (E,F,G, and H groups). Video operations will continue in the Mid Band Segment (A4, B4, C4, D4,G4,F4, and E4) in the markets where they operate today.