Free Shipping On world wide
- HOME
- PRODUCTS
- IN THE NEWS
- SPECTRUM BLOG
- WEB SPECTRUM VIEWER
-
English
-
USD
Free Shipping On world wide
T-Mobile made commitments to the FCC in the Memorandum Opinion and Order in their application for their Auction 108 (2.5 GHz Band Licenses). T-Mobile committed to divest by sale or swap, 20 MHz of spectrum in the AWS-1, AWS3, PCS, or 2.5GHz bands. The spectrum sold will be no smaller than 10 MHz blocks of TDD spectrum or 5x5 MHz blocks of FDD (paired) spectrum. T-Mobile has twelve months to file the transfer applications.
The FCC specifically called out two CMA markets where T-Mobile will need to divest spectrum: CMA385 - Kauai and CMA386 - Maui. Although T-Mobile's held spectrum in Hawaii doesn't stand out compared to other markets in the US, the issue with the spectrum screen in Hawaii is that 3.45 GHz spectrum (100 MHz) and C-band spectrum (280 MHz) are not available. This reduces the available spectrum by almost 400 MHz, thus reducing the spectrum screen by potentially 126 MHz.

In the above map, the CMA markets in Hawaii are indicated. To see how each carriers spectrum totals up in each of these markets we will utilize our Web Spectrum Viewer - Spectrum Depth Module. First we have exported the county spectrum totals by band classification. Kalawao and Maui county make up CMA 386 and Kauai county makes up CMA385. The bottom 3 counties in the chart below represent the counties where T-Mobile needs to divest 20 MHz of spectrum.

Reviewing the data, it is clear that T-Mobile's lower mid-band spectrum and upper mid-band spectrum are the two areas where T-Mobile has a sizable advantage. I assume that EBS/BRS spectrum is off the table from T-Mobile's perspective and it would be difficult to sell that band due to T-Mobile's nationwide "exclusive" use.

Looking then at the lower mid-band spectrum, T-Mobile's held spectrum in both the AWS-1 and AWS-3 bands is pretty similar with Verizon and AT&T.

I will also note that if T-Mobile was to give up any of their AWS-1/AWS-3 spectrum holdings they would drop below their desired 20MHz channel in NR band 66.

There are two considerations for T-Mobile's PCS spectrum. First, T-Mobile controls two blocks of spectrum in all of the Hawaii counties, 15 MHz at the bottom of the band and 20 MHz at the top. I believe that T-Mobile's agreement with SpaceX utilizes the PCS G channels at the top of the PCS band, so I think the upper block will be retained. In a perfect world, T-Mobile would sell a 10x10 slice (A8-A11) of their lower block of spectrum to Verizon and swap their A6-A7 spectrum with Verizon for Verizon's F1-F2 spectrum. In this scenario, Verizon would increase their channel size in two of these counties from 10/10 to 20/20 and in Kauai they would have 25/25. T-Mobile would then have all of their spectrum together and could have a NR band 25 - 20MHz channel and a dedicated 5 MHz channel for SpaceX.
Add your thoughts to our LinkedIn post or the post on X.
(DA No. 24-183). Public Notice announcing that certain Auction 108 licenses are granted.
On January 4th, Fierce Wireless posted a story on T-Mobile's six component carrier aggregation test with Ericsson and Qualcomm. 6 Carrier Aggregation, also known as 6CA, is a cutting-edge technology that allows mobile carriers to combine multiple frequency bands to increase network speed and capacity. By aggregating six carriers, T-Mobile can deliver faster download and upload speeds, reduced latency, and improved overall network performance.
What was interesting in the article from a spectrum expert standpoint are the details they included and the details that were left out. Let's first look at the details that were included:
I am going to use our current Mobile Carrier - Spectrum Ownership Analysis Tool to determine the markets where T-Mobile has two blocks of PCS spectrum, two blocks of AWS spectrum and two blocks of 2.5GHz spectrum.
Using the NR Channel Analysis Module, the specific 3GPP channels that are available for T-Mobile's spectrum in a particular county are displayed by NR band. In the image below, we have filtered to display counties where T-Mobile holds two blocks of n25 spectrum and two blocks of n66 spectrum.
Channel Analysis - FDD Downlink:

This filter also included 2.5 GHz spectrum. I wanted to find counties with both a 100 MHz channel and a 90 MHz channel to get the maximum throughput.
Channel Analysis - TDD:

I'm not quite sure how they arrived at 245 MHz for the combined spectrum. If I only look at the FDD Downlink and the TDD spectrum, I can get 245 MHz with the configuration below.. This configuration is available to T-Mobile in 69 counties.
| Channel Size (MHz) | NR Band |
| 100 | n41 |
| 90 | n41 |
| 20 | n25 |
| 10 | n25 |
| 20 | n66 |
| 5 | n66 |
| 245 | Total |
To get the estimated composite channel throughput values, we have modeled 4x4 MIMO antennas with 256QAM modulation in our Throughput Analysis Tool, which is part of the Channel Analysis Module
Throughput Analysis - FDD Downlink:

Throughput Analysis - TDD Downlink Timeslots:

Throughput Summary:
| Channel Size (MHz) | NR Band | Throughput (Gbps) |
| 100 | n41 | 1.736 |
| 90 | n41 | 1.558 |
| 20 | n25 | 437 |
| 10 | n25 | 411 |
| 20 | n66 | 556 |
| 5 | n66 | 206 |
| 245 | Total | 4.904 |
Although I ended up with a higher throughput than was achieved in the test call, my throughput values are theoretical and would be reduced by real world conditions such as distance to the cell site and the achievable modulation.


The recent news highlighting a FCC proceeding into the spectrum screen referenced, some analysis by Raymond James establishing T-Mobile dominance with 350MHz of spectrum on average in the nation's top markets.
To see how that plays out on a market by market basis, I am going to use the spectrum screen analysis data from Spektrum Metric's Spectrum Ownership Analysis Tool which details the spectrum that applies to the screen for all of the US counties or for all of the US Cellular Market Areas (CMA). The chart below is for the Top 49 CMA markets by population (2021 estimated population). The markets are sorted from highest population on the left to the lowest population on the right. I have eliminated San Juan, PR because the national carrier's don't have a consistent investment strategy for many of the US territories including Puerto Rico.

In Fierce Wireless' article on T-Mobile's initial lease of Comcast's 600MHz spectrum, there were 3 markets highlighted as "required" as part of the purchase agreement. These three markets are New York City, Orlando, and Kansas City. In this post we want to examine the effect on the effective Band 71 NR channel size that T-Mobile will be utilizing for their low band 5G network in these markets.
To see all of the markets where Comcast has 600MHz spectrum, we will utilize our Web Spectrum Viewer - Mapping.
Comcast 600MHz Licenses:

A simple way to view the current and the new channel size is to view T-Mobile and Comcast's 600MHz licenses in our Web Spectrum Viewer - Spectrum Grid.
New York PEA Market Licenses:
In the New York market, T-Mobile currently controls 2x15MHz of spectrum enabling a 15MHz uplink and downlink channel. With the addition of Comcast's adjacent A block spectrum T-Mobile will be able to increase their channel size in the 600MHz band to 20MHz.

Kansas City PEA Market Licenses:
In the Kansas City market, T-Mobile currently controls 2x15MHz of spectrum enabling a 15MHz uplink and downlink channel. With Comcast's E block spectrum T-Mobile will be able to increase their channel size in the 600MHz band to 20MHz.

Orlando PEA Market Licenses:
In the Orlando market, T-Mobile currently controls 2x10MHz of spectrum enabling a 10MHz uplink and downlink channel. With Comcast's E block spectrum T-Mobile will be able to increase their channel size in the 600MHz band to 15MHz.

On July 11, 2019, the FCC released a report and order that provided a pathway to commercial ownership of the 2.5GHz Educational Broadcast Service (EBS) channels that were previously reserved for educational groups. In this post, I am going to examine the progress that T-Mobile has made in shifting from leasing this spectrum to owning it.
We will be looking at two trends, using historical data from Spektrum Metric's Mobile Carrier - Spectrum Ownership Analysis Tool. The Mobile Carrier - Spectrum Ownership Analysis Tool is updated monthly and provides historical analysis going back to 2014.
Looking at our Spectrum Ownership Grid in the Web Spectrum Viewer, T-Mobile's control of the EBS spectrum is clearly seen. This is our Spectrum Grid displaying "Future" data which includes spectrum that T-Mobile leases or has a pending transaction filed.
Spectrum Grid - Future:

Shifting to the Spectrum Ownership Grid to display the spectrum licensee "FCC" reveals the licenses that T-Mobile actually owns. All of the white cells are educational licenses that likely lease their spectrum to T-Mobile.
Spectrum Grid - FCC:

National Weighted Spectrum Depth Trend:
The spectrum available in the EBS and BRS (Broadband Radio Service) bands for each county totals 194 MHz. If T-Mobile controlled every license in every county their National Population Weighted Average spectrum depth in the 2.5 GHz band would be 194 MHz, thus any amount of below 194 MHz represents another licensees ownership or lease of spectrum in these bands.
After the EBS Auction was completed, T-Mobile's total 2.5 GHz spectrum (orange line) rose from roughly 164 MHz to 180 MHz, indicating that about 14 MHz of Nationally Weighted Spectrum is controlled by other carriers and licensees. The spike in September 2022 indicates the release of the auction results.
Over the same time period we quantified the spectrum that was directly owned by T-mobile (blue line). Note: The EBS Auction results are not reflected in this trend line because T-Mobile has not received direct ownership of the licenses. In the December 2010 to June 2023 timeframe, T-Mobile increased their ownership of the EBS spectrum by 11 MHz (National Weighted Population Spectrum Depth).


On December 1, 2022 the FCC began granting the new EBS licenses to the winning bidders from Auction 108. Since many of these licenses are not for complete counties or for the entire auction channel size, I thought it would be useful to see how these licenses appear on the FCC licensing system.
For an example, I have chosen the first auction channel (C1) for Iowa county, Wisconsin, which was purchased by Michigan Wireless.
The map for this license shows all of Iowa county highlighted and all of the C1 frequencies highlighted as well. (If the images are too small to read all of the details, right click on the image and select <Open image in new tab>.

Now looking at the market tab, we will focus on the information at the bottom of the screen. First, all of the 9 component channels (A1, A2, A3, B1, B2, B3, C1, C2, C3) are listed above the county with a full county population value. This would indicate that this license is authorized to cover all 23,687 people living in Iowa county, WI.

Looking back at our outputs from the EBS Whitespace Auction Tool, we can see that representing this license as a complete county license for all of the component channels is not correct.
In our Population Percentage output, it is clear that Michigan Wireless did not purchase the rights to use the B1, B2, and B2 component channels because they were leased to T-Mobile through their lease with the State of Wisconsin -Educational Communications Board. It is also clear that 3% of the county's population cannot be covered with the A1, A2, and A3 component channels.

To see these numbers as raw population values, we will look at our Population output. In this view you can see the population that is licensed for each component channel and the only channels that cover the complete county population are the C1, C2, and C3 channels.

To be accurate, the FCC's market page should be updated to show the actual population available for each channel as seen below:

With the maps updated to show the actual license area for each component channel.
2502.0-2507.5, 2507.5-2513.0, 2513.0-2518.5 MHz (A1,A2,A3):

2518.5-2524.0, 2524.0-2529.5, 2529.5-2535.0 MHz (B1, B2, B3):

2535.0-2540.5, 2540.5-2546.0, 2546.0-2551.5 MHz (C1, C2, C3)

A little over a week ago, T-Mobile announced that they were purchasing additional 600MHz spectrum from Columbia Capital. Immediately, we began receiving phone calls to determine which markets T-Mobile would be increasing their 600MHz spectrum holdings. Unfortunately, the FCC application for this transaction has not be filed so our best view into these licenses is found by finding the licenses that T-Mobile is currently leasing from Columbia Capital.
Looking first at the Spectrum Grid in our Web Spectrum Viewer, we can see the markets and the channels that Columbia Capital controls. Our Spectrum Grid can display 3 types of spectrum ownership data: 1) The license owner (FCC), 2) The current operator (Current), or 3) The Future Owner. In this example we want to find the spectrum that Columbia Capital owns, so we are choosing FCC in the filters.


On Friday, the FCC posted the results from Auction 110. On Saturday we updated the January 2021 release of our Mobile Carrier - Spectrum Ownership Analysis Tool to reflect the auction results. These results provide the most detailed view of each carrier's spectrum that can be deployed for 5G, particularly all of the available upper mid-band spectrum including EBS/BRS, 3.45GHz, CBRS, and C-band.
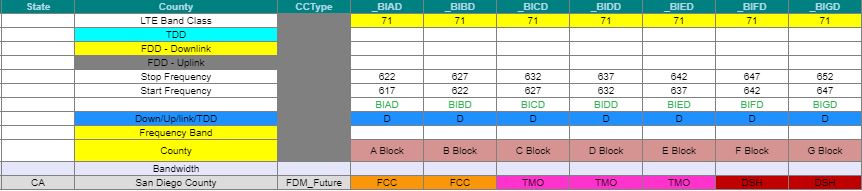
In the Spectrum Grid, we can see the channel allocations. In general, Dish took the upper end of the band with T-Mobile and AT&T alternate having the lower parts of the band. In many markets, AT&T is pinned in the middle of the band between T-Mobile, Grain, and Columbia Capital. Each of the spectrum investors has selected spectrum assignments adjacent to AT&T's spectrum meaning they are each well positioned to sell to AT&T if the 3.45GHz spectrum cap is lifted.

In the National Band Ownership slides we look at each carrier's ownership based upon the percent of MHz-POPs that they control.
For the 3.45GHz band, AT&T leads the way with 39% of the MHz-POPs, Dish has 30%, T-Mobile has 12%, and USCellular has 4%.

Looking the the complete picture for Upper Mid-band spectrum, T-Mobile still leads with 34%, Verizon follows with 30%, then AT&T with 24%. Dish has 9% of the upper mid-band MHz-POPs and USCellular has 2%.
In our most recent blog post, we highlighted the challenges faced by T-Mobile in two markets where they don't control parts of the EBS spectrum (channels), that limit their deployment of large 5G channels across each urban market. Where that post focused on the effects of owning or not owning a specific channel across a geography, the EBS Spectrum Control Maps below provide a more general look at the percent of EBS spectrum that T-Mobile owns, the FCC owns, and Other Carriers own. To complete this analysis we used the MHz-POPs analysis from our EBS Auction Tool, combined with our analysis of T-Mobile's EBS MHz-POPs using the same geographic licensing database.
While these maps provide insights on the EBS band in totality, the individual issues faced by T-Mobile in Orange County, CA don't strongly appear in these maps because they control all of the EBS channels except the G channels meaning they still control a high percentage of the EBS spectrum in Orange County. For the Chicago market, the whitespace EBS challenges can be seen with Lake County receiving a light green and McHenry receiving an orange.


Recent discussions around the wireless industry have included opining on why T-Mobile acquired 40MHz of C-band spectrum when they control so much 2.5GHz spectrum. Although the 2.5GHz spectrum is a valuable spectrum asset, there are two challenges to this spectrum that are not well understood by the industry and we believe that T-Mobile’s C-band purchases were a strategic purchase to provide a path to overcome these two spectrum licensing limitations.
License Areas Controlled by the FCC:
The first limitation is unlicensed or whitespace areas in core urban markets. To highlight these areas, we are going to start with some whitespace analysis that we have developed as part of our EBS Auction Tool. In this analysis, the percentage of the population that is available in the whitespace area is indicated for each EBS channel in a county. We have also calculated the percentage of the population that is contained with T-Mobile license area and the percentage of the population that is contained within the license area of any other carrier. In the image below we are showing the percentage of the population under T-Mobile’s control and under the FCC control (whitespace) for the entire 2.5GHz frequency band including both the EBS and BRS channels. The color ranges start at 0% with red, 50% with yellow, and 100% with green. In our initial analysis we will be focusing on the first auction channel (black box) in the six counties that make up the Chicago CMA market. We prefer to use the CMA market structure to evaluate urban areas because they include only the most populated counties in each urban area.
2.5GHz Full-band Population Percentage View (Chicago):

2.5GHz – 1st EBS Auction Channel Population Percentage View (Chicago):


In the top section of the chart above, it is apparent that T-Mobile controls all of the 1st EBS Auction channel in Cook, DuPage, and Will counties but they only control all of the A1-A2-A3 channels in Kane County. Fortunately, the parts of 1st EBS Auction channel that they don’t own will be available in the Auction 108. The available whitespace is indicated in the lower half of the chart. Looking at McHenry County, 100% of the C1-C2 channels will be available in the EBS Auction (108).
These charts highlights the percentage of the population available either for T-Mobile’s licenses or for the FCC’s whitespace. Next we will look at the geographic constraints of T-Mobile’s licenses and the shape of each county’s whitespace area. In the map below we are able to show the license areas for the A1-A2-A3 channels because the license areas of interest are identical. It is apparent that T-Mobile has the rights to operate the A1-A2-A3 channels completely across the counties in the Chicago CMA except Lake and McHenry.
Licensing Map – A1-A2-A3 (Chicago):

Looking at the B1-B2-B3 & C3 channels, a whitespace area exists covering almost all of Kane County along with similar whitespace areas in McHenry and Lake counties.
Licensing Map – B1-B2-B3 & C3 (Chicago):

Our final map delineates the largest limitations to the areas that T-Mobile can deploy the C1-C2 channels in the Chicago CMA market. Their base stations located in the gray areas of Kane, Lake, and McHenry counties cannot use the C1-C2 channels.
Licensing Map – C1-C2 (Chicago):
Looking again at the T-Mobile’s control of the 1st EBS auction channel we can highlight the deployment limitations that the whitespace area presents. Since the 1st Auction channel is 49.5MHz, this chart indicates that T-Mobile can deploy roughly a 50MHz channel on any sites in Cook, DuPage, and Will counties. In Kane County they are limited to a 15MHz channel in the available 16.5MHz of spectrum. To have a consistent deployment of a 50MHz channel across Chicago, they would need to purchase the whitespaces areas for each of these channels in each of the Chicago counties.


Looking again at the T-Mobile’s control of the 1st EBS auction channel we can highlight the deployment limitations that the whitespace area presents. Since the 1st Auction channel is 49.5MHz, this chart indicates that T-Mobile can deploy roughly a 50MHz channel on any sites in Cook, DuPage, and Will counties. In Kane County they are limited to a 15MHz channel in the available 16.5MHz of spectrum. To have a consistent deployment of a 50MHz channel across Chicago, they would need to purchase the whitespaces areas for each of these channels in each of the Chicago counties.
The last perspective that we want to share on the Chicago market is the actual population in each of the whitespace areas for each county. Although we thought that 100% of the population was available for each channel in Cook County, the whitespace population table indicates that there is a very small population and small geographic area that is a whitespace within Cook County for the B1-B2-B3-C1-C2-C3 channels.
2.5GHz – 1st EBS Auction Channel Population View - Whitespace (Chicago):

License Areas Controlled by Other Carriers:
The second limitation is spectrum blocks that are controlled by other carriers in core urban markets. To highlight these areas we are going to look at the four counties in the Los Angeles CMA market. For the Population Percentage Chart below, we are including the population percentage for other carriers rather than the whitespace percentages.
2.5GHz Full-band Population Percentage View (Los Angeles):

2.5GHz – 3rd EBS Auction Channel Population Percentage View (Los Angeles):

In the Top View it is apparent that T-Mobile already controls the spectrum across all of the BRS channels (gray) in Los Angeles County but they are missing roughly 10% of the population for the G1-G2-G3 channels. In between the two BRS blocks of spectrum are the K guard band channels. The ownership of these guard band channels mirrors the ownership of the primary channel e.g. G1=KG1. The BRS channels and the EBS G1-G2-G3 channels total to 87MHz of spectrum, providing T-Mobile the ability to deploy an 80MHz NR channel throughout most of Los Angeles County. Unfortunately in Orange County, another carrier owns 98% of the G1-G2-G3 channels limiting T-Mobile to a 10MHz channel in the first BRS block (F4-E4) and a 50MHz channel in the second BRS block (BRS2-E123-F123-H123).
Los Angeles CMA Counties:

In looking at the G1-G2-G3 licensing map, you can see that there are actually three licenses that T-Mobile does not control in the Los Angeles CMA Market.
Licensing Map – G1-G2-G3:

2.5GHz – 3rd Auction Channel Population View – Other Carriers (Los Angeles):

The Other Carriers Population percentage view indicates the large licensed population that is controlled by other carriers and would need to be purchased by T-Mobile.
Conclusion:
With these two examples we have shown that missing 2.5GHz spectrum either due to it being unlicensed or being controlled by another carrier present challenges that likely limit T-Mobile’s largest 5G channel size to a subset of each urban market. We believe that T-Mobile’s participation in the C-band and the current 3.45GHz auction was to “future” proof their ability to offer large channel sizes in the upper mid-band spectrum. With either the C-band spectrum or the 3.45GHz spectrum, T-Mobile could use carrier aggregation to achieve 100MHz effective channel sizes even in areas where their 2.5GHz spectrum is more limited.


Last week we began to see announcements from the FCC authorizing a series of temporary spectrum usage agreements to provide additional spectrum to several of the wireless operators to increase network capacity as workers are dispatched to their homes.
We will look at the effect of these agreements in a few markets to see how they are increasing LTE capacity. The analysis will be supported with outputs from our Mobile Carrier - Spectrum Ownership Analysis Tool specifically the Spectrum Ownership Grid.
T-Mobile 600MHz Capacity Expansion:
The first agreement provides T-Mobile with access to 600MHz spectrum from Bluewater Wireless, Channel 51 LIcense Co and LB License Co (Columbia Capital), CC Wireless Investment (Comcast), ParketB.com Wireless (Dish), New Level (Grain), and Tstar License Holdings (Tri-Star).
In the image below for the New York CMA market, T-Mobile will have access to Comcast's spectrum (XFI) and Dish's spectrum increasing their 600MHz channel size in New York from 10MHz channel to a 20MHz channel. T-Mobile would have access to the entire 35MHz of spectrum so they could provide a 20MHz channel and a 10MHz channel for capacity. Because T-Mobile has already deployed Band 71 equipment in New York, they can turn up the expanded spectrum without additional equipment installations.

USCellular AWS-3 Capacity Expansion:
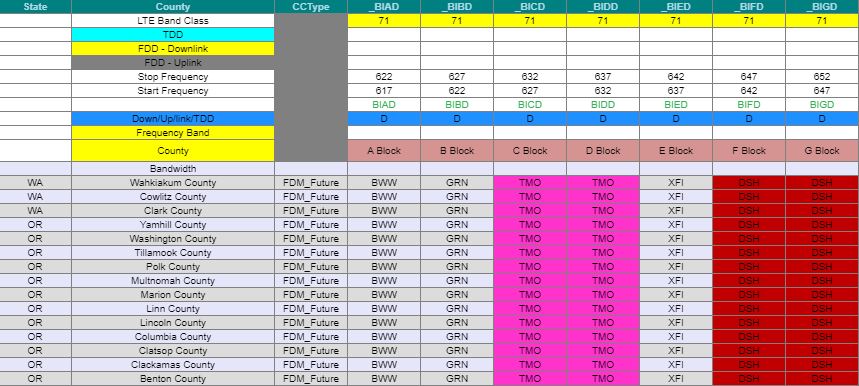
The next agreement provides USCellular access to AWS-3 spectrum from their bidding partner Advantage Spectrum. In the image below a few of the Washington markets where USCellular will access AWS-3 spectrum are indicated. In most of these markets, USCellular currently operates on their cellular frequencies but doesn't have Band 66 operations.Thus, USCellular will need to add base stations and antennas to their sites for Band 66 to utilize these new frequencies. In five of these counties USCellular is likely operating on AWS-1 spectrum in Band 66 so the spectrum will be easier to deploy in those counties.

Verizon AWS-3 Capacity Expansion:
In the image below we illustrate the AWS-3 spectrum that Verizon will gain temporary access from SNR License Co and Northstar Wireless (both Dish partners). Northstar controls the AWS-3 G channel and SNR LIcense Co controls the AWS-3 H channel. In the New York market, Northstar Wireless owns the G block spectrum and SNR Wireless owns the H block spectrum. Accessing this spectrum will provide Verizon a second Band 66 LTE channel, increasing their LTE capacity from 20MHz to 30MHz.

Verizon & AT&T AWS-3 Capacity Expansion:
Verizon and AT&T have also requested access to the spectrum that Northstar Wireless and SNR Wireless returned to the FCC when their auction discounts were eliminated. The AWS-3 spectrum depth that is "unassigned" is indicated in the map below. In our data, we reflect these unassigned licenses with the FCC heading.

AT&T requested the I block spectrum in the New York market, so it will expand their Band 66 LTE from 10MHz to 15MHz. The markets AT&T requested are listed here and the markets that Verizon requested are here.

AT&T AWS-4 Capacity Expansion:
AT&T has also requested access to Dish's Band 66 spectrum. From the image above AT&T can expand their Band 66 LTE by and additional 5MHz to 20MHz by using part of Dish's AWS-4 spectrum. AT&T will still have an additional 15MHz of Dish's spectrum that they could use as an additional LTE channel in New York. AT&T only requested access to Dish's Band 66 spectrum, not their Band 70 AWS-4 spectrum.
AT&T 700MHz E-block Expansion:
Dish also reported that AT&T requested access the the 700MHz E-block in the markets that AT&T doesn't own. In the image below, Dish's ownership in Chicago and Detroit will provide AT&T the capability to expand their Band 29 supplemental downlink from 5MHz to 10MHz.

One of the benefits of Allnet Insights' Spectrum Ownership Analysis Tools, is the repository of monthly releases that we have accumulated. With the USA Mobile Carrier Tool we have monthly versions going back to July 2012. Each of our historical tools details spectrum ownership and the variety of spectrum depth analysis modules that were supported at that time.
I thought it would be interesting to look back at the spectrum ownership landscape from July 2012. Looking first at our Spectrum Grid for low band spectrum, you can see that Verizon still holds the 700MHz B block licenses that were sold later to AT&T. In addition, Verizon also holds the 700MHz A block licenses that were sold to T-Mobile.

Looking next at the lower mid band spectrum, former licensees like SpectrumCo, Leap Wireless, and MetroPCS still control blocks of AWS-1 and PCS spectrum. This view of spectrum ownership also allows you to see how Verizon consolidated their AWS-1 spectrum holdings with SpectrumCo's holdings into a 20 MHz block through spectrum license trades with T-Mobile and their MetroPCS licenses. Today Verizon controls the lower 20 MHz of the AWS-1 band and T-Mobile controls the upper 25 MHz in the New York / New Jersey counties.

Looking at the upper mid band spectrum we first see all of the original WCS spectrum licensees: Horizon Wi-Com, Nextwave, Sprint, Comcast, and San Diego Gas & Electric. Clearwire also appears in the upper mid band Spectrum Grid with their 2.5GHz spectrum holdings.

It is interesting then to look at our County Analysis module to see the detail on each carrier's spectrum depth. It is noteworthy to mention that Verizon has 119 MHz of spectrum in most of the New York / New Jersey counties with AT&T trailing with 91 MHz of spectrum. Verizon still sits with rough the same amount of spectrum although they replaced all of the 700MHz spectrum they sold to AT&T and T-Mobile with SpectrumCo spectrum and AWS-3 spectrum while AT&T has growth while AT&T has grown their spectrum depth in the same counties to 161 MHz.

In July we expanded the analysis capabilities of our Mobile Carrier and Millimeter Wave - Spectrum Ownership Analysis Tools to include 5G New Radio(NR) Band Analysis for each of the 3GPP supported bandwidths in each US NR band class.
First, in the Mobile Carrier Tool, we are supporting both the uplink and downlink NR bands separately for bands that provide Frequency Division (FDD) operation. This analysis module outputs the largest channel size (for both uplink and downlink) that a carrier could deploy in their 5G/LTE uplink carrier aggregation scheme or their downlink carrier aggregation scheme. Below in the downlink analysis for AT&T you can see the maximum channel sizes for n12 band spectrum (700MHz A/B/C) versus their n29 band spectrum (700MHz D/E),which is downlink only, and their n14 band spectrum (FirstNet); for each county in the New York Cellular Market Area (CMA).

Similarly, the uplink analysis indicates the maximum uplink channel size for all of the uplink spectrum.

The n41 band spectrum that Sprint's controls (2.5GHz) is seen in the Time Division Duplex(TDD) section. The analysis tool determines the largest contiguous channel that Sprint can deploy with their leases/owned spectrum including the mid-band segment guard bands. From the results below, Sprint can configure 80MHz 5G/LTE channels in two New York counties and they can configure a 60MHz channel in one additional New York county. The remaining counties are limited to carrier aggregation of 20MHz channels.

In the Millimeter Wave - Spectrum Ownership Analysis Tool, all of the spectrum is configured to Time Division Duplex(TDD) operation. Below, you can see the different bandwidths that T-Mobile can deploy using their 24GHz or 28GHz spectrum in the New York counties. Each of the 3GPP standardized bandwidths of 400, 200, 100, and 50MHz are detailed for each spectrum band.

On March 21st, the FCC released a Notice of Procedures describing how existing 39GHz spectrum ownership below will be remapped to the new 39GHz configuration. We thought it would be beneficial to see how the FCC arrived at their results.
Current Configuration:

Future Configuration:

The procedures the FCC announced will provide a route for the existing 39GHz owners to essentially trade-in their spectrum for vouchers that can be used in Auction 103. The FCC published a summary of the aggregated holdings data for each of the 39GHz licensees so we decided to use the data from our Millimeter Wave - Spectrum Ownership Analysis Tool to show the underlying calculations.

We are able to use the data from our Millimeter Wave - Spectrum Ownership Analysis Tool to determine the aggregate MHz-POPs value for PEA003 (Chicago). To find the aggregate MHz-POPs we must first find the MHz-POPs contribution for each of AT&T's licenses (call signs) in the Chicago market. Below are each of the county MHz-POPs components for each call sign. We have indicated whether the license covers the entire county or whether it is a partial license in the Full/Partial County column. The county MHz-POPs component is found by multiplying the bandwidth for each call sign by the county population. The total aggregate MHz-POPs is the sum of the county MHz-POPs for all of AT&T's licenses. Using this process, we have found AT&T's aggregate MHz-POPs to by 2,817,188,800 compared to the FCC's results of 2,815,434,000.
| Market | CallSign | Channel Block | Full/Partial County | State | County | Bandwidth | County Population | MHz-POPs |
| PEA003 | WRBI252 | 1A | Full | IL | Cook County | 50 | 5,194,675 | 259,733,750 |
| Chicago | DuPage County | 50 | 916,924 | 45,846,200 | ||||
| Grundy County | 50 | 50,063 | 2,503,150 | |||||
| Kane County | 50 | 515,269 | 25,763,450 | |||||
| Kankakee County | 50 | 113,449 | 5,672,450 | |||||
| Kendall County | 50 | 114,736 | 5,736,800 | |||||
| Lake County | 50 | 703,462 | 35,173,100 | |||||
| McHenry County | 50 | 308,760 | 15,438,000 | |||||
| Will County | 50 | 677,560 | 33,878,000 | |||||
| IN | Lake County | 50 | 496,005 | 24,800,250 | ||||
| LaPorte County | 50 | 111,467 | 5,573,350 | |||||
| Porter County | 50 | 164,343 | 8,217,150 | |||||
| WRBI253 | 1B | Full | IL | Cook County | 50 | 5,194,675 | 259,733,750 | |
| DuPage County | 50 | 916,924 | 45,846,200 | |||||
| Grundy County | 50 | 50,063 | 2,503,150 | |||||
| Kane County | 50 | 515,269 | 25,763,450 | |||||
| Kankakee County | 50 | 113,449 | 5,672,450 | |||||
| Kendall County | 50 | 114,736 | 5,736,800 | |||||
| Lake County | 50 | 703,462 | 35,173,100 | |||||
| McHenry County | 50 | 308,760 | 15,438,000 | |||||
| Will County | 50 | 677,560 | 33,878,000 | |||||
| IN | Lake County | 50 | 496,005 | 24,800,250 | ||||
| LaPorte County | 50 | 111,467 | 5,573,350 | |||||
| Porter County | 50 | 164,343 | 8,217,150 | |||||
| WRBI590 | 4A | Full | IL | Cook County | 50 | 5,194,675 | 259,733,750 | |
| DuPage County | 50 | 916,924 | 45,846,200 | |||||
| Grundy County | 50 | 50,063 | 2,503,150 | |||||
| Kane County | 50 | 515,269 | 25,763,450 | |||||
| Kankakee County | 50 | 113,449 | 5,672,450 | |||||
| Kendall County | 50 | 114,736 | 5,736,800 | |||||
| Lake County | 50 | 703,462 | 35,173,100 | |||||
| McHenry County | 50 | 308,760 | 15,438,000 | |||||
| Will County | 50 | 677,560 | 33,878,000 | |||||
| IN | Lake County | 50 | 496,005 | 24,800,250 | ||||
| LaPorte County | 50 | 111,467 | 5,573,350 | |||||
| Porter County | 50 | 164,343 | 8,217,150 | |||||
| WRBI591 | 4B | Full | IL | Cook County | 50 | 5,194,675 | 259,733,750 | |
| DuPage County | 50 | 916,924 | 45,846,200 | |||||
| Grundy County | 50 | 50,063 | 2,503,150 | |||||
| Kane County | 50 | 515,269 | 25,763,450 | |||||
| Kankakee County | 50 | 113,449 | 5,672,450 | |||||
| Kendall County | 50 | 114,736 | 5,736,800 | |||||
| Lake County | 50 | 703,462 | 35,173,100 | |||||
| McHenry County | 50 | 308,760 | 15,438,000 | |||||
| Will County | 50 | 677,560 | 33,878,000 | |||||
| IN | Lake County | 50 | 496,005 | 24,800,250 | ||||
| LaPorte County | 50 | 111,467 | 5,573,350 | |||||
| Porter County | 50 | 164,343 | 8,217,150 | |||||
| WRBJ298 | 8A | Full | IL | Cook County | 50 | 5,194,675 | 259,733,750 | |
| DuPage County | 50 | 916,924 | 45,846,200 | |||||
| Grundy County | 50 | 50,063 | 2,503,150 | |||||
| Kane County | 50 | 515,269 | 25,763,450 | |||||
| Kankakee County | 50 | 113,449 | 5,672,450 | |||||
| Kendall County | 50 | 114,736 | 5,736,800 | |||||
| Lake County | 50 | 703,462 | 35,173,100 | |||||
| McHenry County | 50 | 308,760 | 15,438,000 | |||||
| Will County | 50 | 677,560 | 33,878,000 | |||||
| IN | Lake County | 50 | 496,005 | 24,800,250 | ||||
| LaPorte County | 50 | 111,467 | 5,573,350 | |||||
| Porter County | 50 | 164,343 | 8,217,150 | |||||
| WRBJ299 | 8B | Full | IL | Cook County | 50 | 5,194,675 | 259,733,750 | |
| DuPage County | 50 | 916,924 | 45,846,200 | |||||
| Grundy County | 50 | 50,063 | 2,503,150 | |||||
| Kane County | 50 | 515,269 | 25,763,450 | |||||
| Kankakee County | 50 | 113,449 | 5,672,450 | |||||
| Kendall County | 50 | 114,736 | 5,736,800 | |||||
| Lake County | 50 | 703,462 | 35,173,100 | |||||
| McHenry County | 50 | 308,760 | 15,438,000 | |||||
| Will County | 50 | 677,560 | 33,878,000 | |||||
| IN | Lake County | 50 | 496,005 | 24,800,250 | ||||
| LaPorte County | 50 | 111,467 | 5,573,350 | |||||
| Porter County | 50 | 164,343 | 8,217,150 | |||||
| WRBK275 | 13A | Partial | IL | Kane County | 50 | 21,235 | 1,061,750 | |
| Kendall County | 50 | 13,076 | 653,800 | |||||
| McHenry County | 50 | 37,438 | 1,871,900 | |||||
| 13B | Partial | IL | Kane County | 50 | 21,235 | 1,061,750 | ||
| Kendall County | 50 | 13,076 | 653,800 | |||||
| McHenry County | 50 | 37,438 | 1,871,900 | |||||
| 2,817,188,800 |
The Market MHz-POPs value is found by multiplying the new 39GHz channel size (100MHz) by the total population of the Chicago PEA.
| Market | Bandwidth | PEA Population | Market MHz-POPs |
| PEA003 (Chicago) | 100 | 9,366,713 | 936,671,300 |
The next calculation provides the number of blocks that AT&T is authorized to receive in the 39GHz auction by relinquishing their current licenses. Our analysis indicates that AT&T will start with slightly more than 3 - 100MHz channel blocks in Chicago before the auction starts.
| Market | Aggregate MHz-POPs | Market MHz-POPs | Channel Blocks |
| PEA003 (Chicago) | 2,817,188,800 | 936,671,300 | 3.00766 |
Two questions for all of the wireless network installers and drive testers:
1) Where can you get the spectrum assignments for all of the mobile carrier bands with in a county?
2) How can you determine if the licensed spectrum assignment will change in the near future?
Allnet Insights' Web Spectrum Viewer now includes a Wireless Survey which details the wireless carrier that currently controls each block of Mobile Carrier spectrum (600MHz-2.5GHz) for a selected US county. In addition, the Wireless Survey indicates whether there are any filed transaction that will move that spectrum to another wireless carrier, as indicated in the Future column.
The output table details the spectrum assignments,licensees, and bandwidth for each block and is sorted from lowest frequency to highest frequency. This output table can be exported as a .csv file.


| Purpose | Assignee | Assignor | CallSign | Map | RadioService | Market | ChannelBlock |
| New Lease | Cimaron Telephone | Cross Telephone Company | WRBQ838 | AWS3 | CMA598 - Oklahoma 3 - Grant | G | |
| New Lease | GE MDS LLC | Access 700 | WPRR314 | 700MHz GB | MEA025 - Nashville | A | |
| New Lease | GE MDS LLC | Access 700 | WPRV427 | 700MHz GB | MEA008 - Atlanta | A | |
| New Lease | GE MDS LLC | Access 700 | WPRV430 | 700MHz GB | MEA024 - Birmingham | A | |
| New Lease | GE MDS LLC | Access 700 | WPRV439 | 700MHz GB | MEA038 - San Antonio | A | |
| New Lease | SpeedConnect | Sprint | B064 | Map | BRS | BTA064 - Butte, MT | BRS1 |
| New Lease | SpeedConnect | Sprint | B064 | Map | BRS | BTA064 - Butte, MT | E4 |
| New Lease | SpeedConnect | Sprint | B064 | Map | BRS | BTA064 - Butte, MT | F1 |
| New Lease | SpeedConnect | Sprint | B064 | Map | BRS | BTA064 - Butte, MT | F2 |
| New Lease | SpeedConnect | Sprint | B064 | Map | BRS | BTA064 - Butte, MT | F3 |
| New Lease | SpeedConnect | Sprint | B064 | Map | BRS | BTA064 - Butte, MT | F4 |
| New Lease | SpeedConnect | Sprint | B064 | Map | BRS | BTA064 - Butte, MT | H1 |
| New Lease | SpeedConnect | Sprint | B064 | Map | BRS | BTA064 - Butte, MT | H2 |
| New Lease | SpeedConnect | Sprint | B064 | Map | BRS | BTA064 - Butte, MT | H3 |
| New Lease | SpeedConnect | Sprint | B144 | Map | BRS | BTA144 - Flagstaff, AZ | BRS1 |
| New Lease | SpeedConnect | Sprint | B144 | Map | BRS | BTA144 - Flagstaff, AZ | E4 |
| New Lease | SpeedConnect | Sprint | B144 | Map | BRS | BTA144 - Flagstaff, AZ | F4 |
| New Lease | SpeedConnect | Sprint | B167 | Map | BRS | BTA167 - Grand Island-Kearney, NE | BRS1 |
| New Lease | SpeedConnect | Sprint | B171 | Map | BRS | BTA171 - Great Falls, MT | BRS2 |
| New Lease | SpeedConnect | Sprint | B171 | Map | BRS | BTA171 - Great Falls, MT | E1 |
| New Lease | SpeedConnect | Sprint | B171 | Map | BRS | BTA171 - Great Falls, MT | E2 |
| New Lease | SpeedConnect | Sprint | B171 | Map | BRS | BTA171 - Great Falls, MT | E3 |
| New Lease | SpeedConnect | Sprint | B171 | Map | BRS | BTA171 - Great Falls, MT | E4 |
| New Lease | SpeedConnect | Sprint | B171 | Map | BRS | BTA171 - Great Falls, MT | F1 |
| New Lease | SpeedConnect | Sprint | B171 | Map | BRS | BTA171 - Great Falls, MT | F4 |
| New Lease | SpeedConnect | Sprint | B202 | Map | BRS | BTA202 - Idaho Falls, ID | BRS1 |
| New Lease | SpeedConnect | Sprint | B202 | Map | BRS | BTA202 - Idaho Falls, ID | BRS2 |
| New Lease | SpeedConnect | Sprint | B202 | Map | BRS | BTA202 - Idaho Falls, ID | E4 |
| New Lease | SpeedConnect | Sprint | B202 | Map | BRS | BTA202 - Idaho Falls, ID | F4 |
| New Lease | SpeedConnect | Sprint | B205 | Map | BRS | BTA205 - Iowa City, IA | BRS1 |
| New Lease | SpeedConnect | Sprint | B205 | Map | BRS | BTA205 - Iowa City, IA | BRS2 |
| New Lease | SpeedConnect | Sprint | B205 | Map | BRS | BTA205 - Iowa City, IA | E4 |
| New Lease | SpeedConnect | Sprint | B205 | Map | BRS | BTA205 - Iowa City, IA | F4 |
| New Lease | SpeedConnect | Sprint | B300 | Map | BRS | BTA300 - Missoula, MT | BRS1 |
| New Lease | SpeedConnect | Sprint | B353 | Map | BRS | BTA353 - Pocatello, ID | BRS1 |
| New Lease | SpeedConnect | Sprint | B353 | Map | BRS | BTA353 - Pocatello, ID | BRS2 |
| New Lease | SpeedConnect | Sprint | B353 | Map | BRS | BTA353 - Pocatello, ID | E4 |
| New Lease | SpeedConnect | Sprint | B353 | Map | BRS | BTA353 - Pocatello, ID | F4 |
| New Lease | SpeedConnect | Sprint | B422 | Map | BRS | BTA422 - Sioux Falls, SD | BRS1 |
| New Lease | SpeedConnect | Sprint | B422 | Map | BRS | BTA422 - Sioux Falls, SD | BRS2 |
| New Lease | SpeedConnect | Sprint | B422 | Map | BRS | BTA422 - Sioux Falls, SD | E4 |
| New Lease | SpeedConnect | Sprint | B422 | Map | BRS | BTA422 - Sioux Falls, SD | F4 |
| New Lease | SpeedConnect | Sprint | B451 | Map | BRS | BTA451 - Twin Falls, ID | BRS1 |
| New Lease | SpeedConnect | Sprint | B451 | Map | BRS | BTA451 - Twin Falls, ID | E4 |
| New Lease | SpeedConnect | Sprint | B451 | Map | BRS | BTA451 - Twin Falls, ID | F4 |
| New Lease | SpeedConnect | Sprint | WFY431 | Map | BRS | P00089 - P35 GSA,40-43-38 N,99-7-41.3 W | BRS1 |
| New Lease | SpeedConnect | Sprint | WFY595 | Map | BRS | P03002 - P35 GSA,41-32-48.1 N,90-27-56.5 W | BRS1 |
| New Lease | SpeedConnect | Sprint | WGW275 | Map | BRS | P03471 - P35 GSA,43-28-24.1 N,83-50-39.9 W | E4 |
| New Lease | SpeedConnect | Sprint | WHI959 | Map | BRS | P00168 - P35 GSA,43-59-30.9 N,96-46-11.2 W | F4 |
| New Lease | SpeedConnect | Sprint | WHT588 | Map | BRS | P03685 - P35 GSA,41-31-58.1 N,90-34-40.5 W | E4 |
| New Lease | SpeedConnect | Sprint | WLK328 | Map | BRS | P01359 - P35 GSA,43-14-38 N,97-22-39.2 W | F4 |
| New Lease | SpeedConnect | Sprint | WLK384 | Map | BRS | P01362 - P35 GSA,43-14-38 N,97-22-39.2 W | E4 |
| New Lease | SpeedConnect | Sprint | WLW827 | Map | BRS | P01384 - P35 GSA,31-25-16.6 N,100-32-37.3 W | F1234 |
| New Lease | SpeedConnect | Sprint | WLW894 | Map | BRS | P01898 - P35 GSA,41-31-58.1 N,90-34-40.5 W | F4 |
| New Lease | SpeedConnect | Sprint | WMH800 | Map | BRS | P02690 - P35 GSA,34-13-58.1 N,112-22-15.6 W | E4 |
| New Lease | SpeedConnect | Sprint | WMI345 | Map | BRS | P01925 - P35 GSA,41-54-33 N,91-39-17.6 W | E4 |
| New Lease | SpeedConnect | Sprint | WMI827 | Map | BRS | P02939 - P35 GSA,34-42-17.1 N,112-6-57.6 W | E4 |
| New Lease | SpeedConnect | Sprint | WMI864 | Map | BRS | P02941 - P35 GSA,34-42-17.1 N,112-6-57.6 W | F4 |
| New Lease | SpeedConnect | Sprint | WML478 | Map | BRS | P03544 - P35 GSA,31-25-16.6 N,100-32-37.3 W | BRS1 |
| New Lease | SpeedConnect | Sprint | WMX344 | Map | BRS | P03719 - P35 GSA,43-30-10.9 N,96-34-39.2 W | F4 |
| New Lease | SpeedConnect | Sprint | WMX358 | Map | BRS | P01947 - P35 GSA,43-30-10.9 N,96-34-39.2 W | E4 |
| New Lease | SpeedConnect | Sprint | WMX656 | Map | EBS | P00155 - P35 GSA,42-43-54 N,114-25-7 W | D1234 |
| New Lease | SpeedConnect | Sprint | WMX678 | Map | EBS | P00017 - P35 GSA,42-43-54 N,114-25-7 W | C1234 |
| New Lease | SpeedConnect | Sprint | WMX908 | Map | BRS | P03551 - P35 GSA,31-25-16.6 N,100-32-37.3 W | E1234 |
| New Lease | SpeedConnect | Sprint | WNTC543 | Map | BRS | P01566 - P35 GSA,31-25-16.6 N,100-32-37.3 W | H1 |
| New Lease | SpeedConnect | Sprint | WNTC543 | Map | BRS | P01566 - P35 GSA,31-25-16.6 N,100-32-37.3 W | H2 |
| New Lease | SpeedConnect | Sprint | WQLW472 | Map | BRS | BTA070 - Cedar Rapids, IA | BRS2 |
| New Lease | SpeedConnect | Sprint | WQLW472 | Map | BRS | BTA070 - Cedar Rapids, IA | E4 |
| New Lease | SpeedConnect | Sprint | WQLW472 | Map | BRS | BTA070 - Cedar Rapids, IA | F4 |
| New Lease | SpeedConnect | Sprint | WQLW474 | Map | BRS | BTA105 - Davenport, IA-Moline, IL | BRS2 |
| New Lease | SpeedConnect | Sprint | WLW970 | Map | BRS | P02673 - P35 GSA,35-14-2 N,111-36-27.6 W | F4 |
| New Lease | SpeedConnect | Sprint | WMI320 | Map | BRS | P02694 - P35 GSA,35-14-29 N,111-36-37.6 W | E4 |
| New Lease | SpeedConnect | Sprint | B011 | Map | BRS | BTA011 - Alpena, MI | BRS1 |
| New Lease | SpeedConnect | Sprint | B011 | Map | BRS | BTA011 - Alpena, MI | E4 |
| New Lease | SpeedConnect | Sprint | B011 | Map | BRS | BTA011 - Alpena, MI | F1 |
| New Lease | SpeedConnect | Sprint | B011 | Map | BRS | BTA011 - Alpena, MI | F2 |
| New Lease | SpeedConnect | Sprint | B011 | Map | BRS | BTA011 - Alpena, MI | F3 |
| New Lease | SpeedConnect | Sprint | B011 | Map | BRS | BTA011 - Alpena, MI | F4 |
| New Lease | SpeedConnect | Sprint | B011 | Map | BRS | BTA011 - Alpena, MI | H1 |
| New Lease | SpeedConnect | Sprint | B011 | Map | BRS | BTA011 - Alpena, MI | H2 |
| New Lease | SpeedConnect | Sprint | B011 | Map | BRS | BTA011 - Alpena, MI | H3 |
| New Lease | SpeedConnect | Sprint | B307 | Map | BRS | BTA307 - Mt. Pleasant, MI | E4 |
| New Lease | SpeedConnect | Sprint | B307 | Map | BRS | BTA307 - Mt. Pleasant, MI | F4 |
| New Lease | SpeedConnect | Sprint | B390 | Map | BRS | BTA390 - Saginaw-Bay City, MI | E4 |
| New Lease | SpeedConnect | Sprint | B390 | Map | BRS | BTA390 - Saginaw-Bay City, MI | F4 |
| New Lease | T-Mobile | RigNet | WPWV330 | 700MHz | CMA306 - Gulf of Mexico | C |