Free Shipping On world wide
- HOME
- PRODUCTS
- IN THE NEWS
- SPECTRUM BLOG
- WEB SPECTRUM VIEWER
-
English
-
USD
Free Shipping On world wide
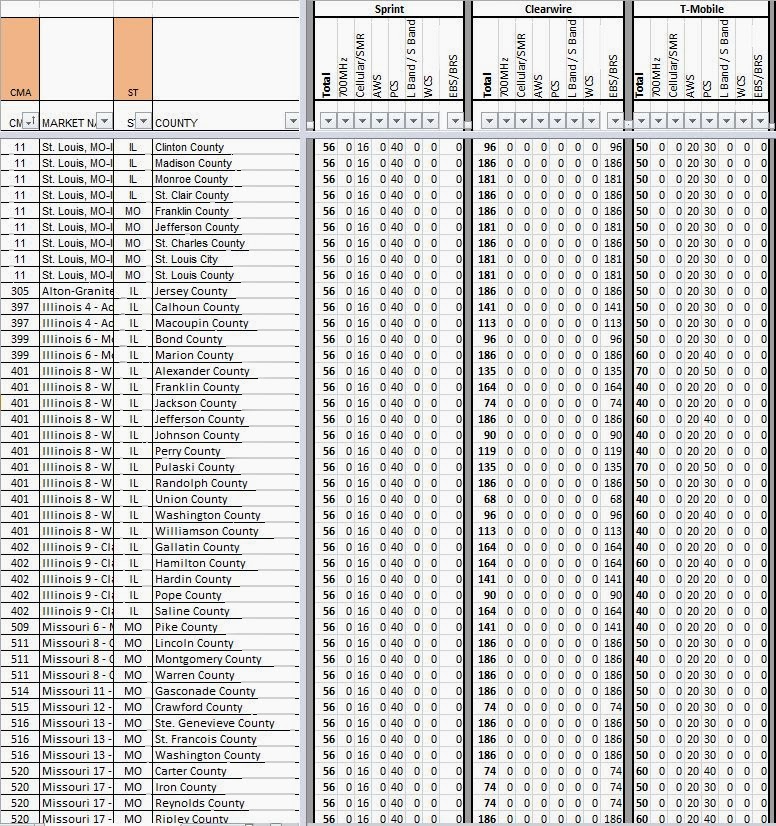
Previously we have written about the CBRS Consent Decree between the FCC and SAL Spectrum, Cable One, NorthWestern Corporation, US Cellular Corporation, and Shenandoah Cable Television. Each of these CBRS auction winners had an investment from Black Rock, Inc greater than 10% interest. Below are charts that reflecting each carrier's auction winnings, the licenses that they requested following the consent decree, and changes to each carriers market assignments.
Looking at the Combined Blackrock from the Auction Results table, there are many markets where the combined group has auction spectrum allotments of 60MHz. In the Updated License table, many markets went from being above the 40MHz limit to being below the 40MHz limit. This is primarily due to SAL Spectrum (ATNI) declining any spectrum assignments in virtually all of these markets.
The last column to highlight is the GAA Increase column in the Change table. This column reflects the net increase in GAA available spectrum in each market since the FCC is not planning to reauction this spectrum since it can still be utilized through the GAA usage process.
Arkansas and Illinois:

Missouri:

Maryland, Montana, Virginia, Washington, and Wisconsin:

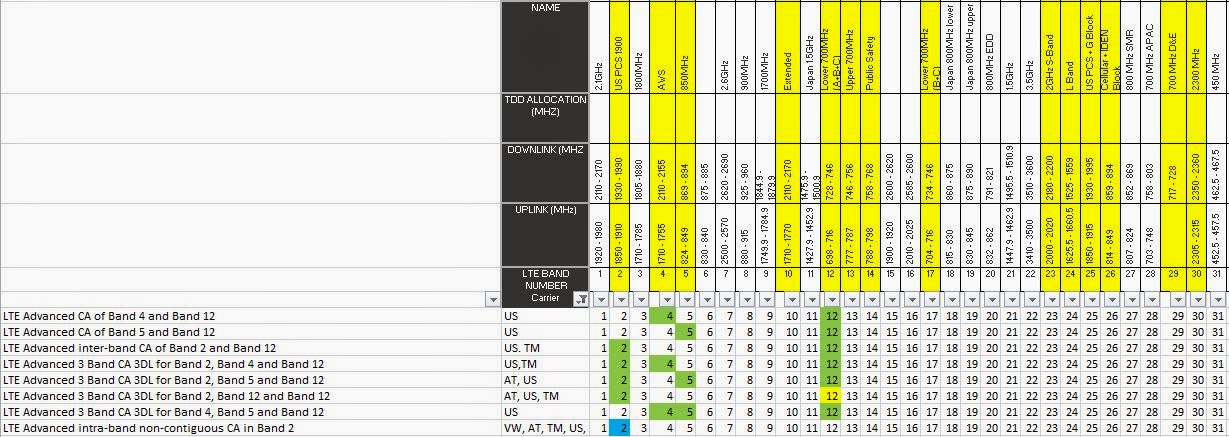
On Friday, the FCC posted the results from Auction 110. On Saturday we updated the January 2021 release of our Mobile Carrier - Spectrum Ownership Analysis Tool to reflect the auction results. These results provide the most detailed view of each carrier's spectrum that can be deployed for 5G, particularly all of the available upper mid-band spectrum including EBS/BRS, 3.45GHz, CBRS, and C-band.
In the Spectrum Grid, we can see the channel allocations. In general, Dish took the upper end of the band with T-Mobile and AT&T alternate having the lower parts of the band. In many markets, AT&T is pinned in the middle of the band between T-Mobile, Grain, and Columbia Capital. Each of the spectrum investors has selected spectrum assignments adjacent to AT&T's spectrum meaning they are each well positioned to sell to AT&T if the 3.45GHz spectrum cap is lifted.

In the National Band Ownership slides we look at each carrier's ownership based upon the percent of MHz-POPs that they control.
For the 3.45GHz band, AT&T leads the way with 39% of the MHz-POPs, Dish has 30%, T-Mobile has 12%, and USCellular has 4%.

Looking the the complete picture for Upper Mid-band spectrum, T-Mobile still leads with 34%, Verizon follows with 30%, then AT&T with 24%. Dish has 9% of the upper mid-band MHz-POPs and USCellular has 2%.
Earlier this month, the FCC announced that they finally released (granted) the CBRS PAL licenses won in Auction 105 by Cross Telephone Company. I thought that this would be a good opportunity to show how the Transactions module in our Web Spectrum Viewer can be used to determine the status of pending transactions.
As an introduction, our Transaction module includes all of the transactions affecting the mobile carrier and millimeter wave spectrum bands, going back to 2014. We capture each of these transactions when they are posted on the FCC Daily Digest and update their status monthly until they are granted.
To find the unissued CBRS licenses, we set the filters to only include the CBRS spectrum transactions, for new licenses, that still have a pending FCC status.
![]()
After setting these filters, the results can be exported as an Excel file.
![]()
Finally, since the Transaction export includes a record for each license that a carrier will receive, I am going to apply a pivot table in Excel, to summarize the 2857 matching records. In the table below, you can see the bidding names for the companies that have not received their CBRS licenses and the count of their outstanding licenses. Cross Telephone is still on this list, because the transactions list is updated monthly with the currently list indicating all of the transactions through the end of November. The Cross Telephone licenses were granted on December 10, 2021 so they will be reflected in the January transaction file update.

Last week we began to see announcements from the FCC authorizing a series of temporary spectrum usage agreements to provide additional spectrum to several of the wireless operators to increase network capacity as workers are dispatched to their homes.
We will look at the effect of these agreements in a few markets to see how they are increasing LTE capacity. The analysis will be supported with outputs from our Mobile Carrier - Spectrum Ownership Analysis Tool specifically the Spectrum Ownership Grid.
T-Mobile 600MHz Capacity Expansion:
The first agreement provides T-Mobile with access to 600MHz spectrum from Bluewater Wireless, Channel 51 LIcense Co and LB License Co (Columbia Capital), CC Wireless Investment (Comcast), ParketB.com Wireless (Dish), New Level (Grain), and Tstar License Holdings (Tri-Star).
In the image below for the New York CMA market, T-Mobile will have access to Comcast's spectrum (XFI) and Dish's spectrum increasing their 600MHz channel size in New York from 10MHz channel to a 20MHz channel. T-Mobile would have access to the entire 35MHz of spectrum so they could provide a 20MHz channel and a 10MHz channel for capacity. Because T-Mobile has already deployed Band 71 equipment in New York, they can turn up the expanded spectrum without additional equipment installations.

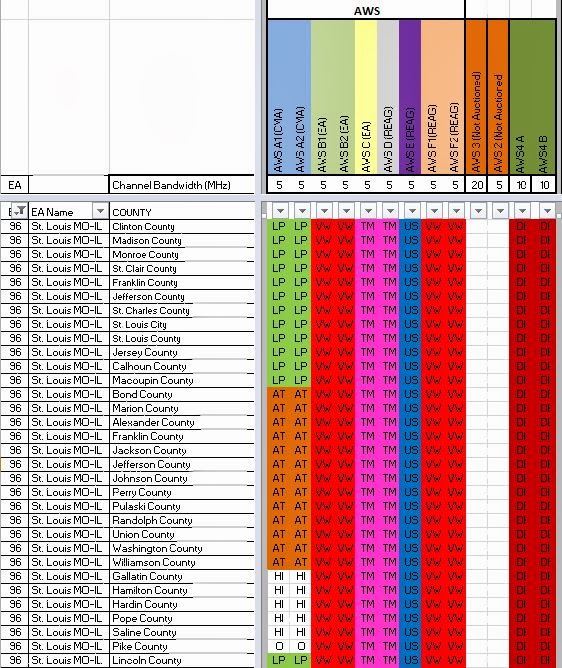
USCellular AWS-3 Capacity Expansion:
The next agreement provides USCellular access to AWS-3 spectrum from their bidding partner Advantage Spectrum. In the image below a few of the Washington markets where USCellular will access AWS-3 spectrum are indicated. In most of these markets, USCellular currently operates on their cellular frequencies but doesn't have Band 66 operations.Thus, USCellular will need to add base stations and antennas to their sites for Band 66 to utilize these new frequencies. In five of these counties USCellular is likely operating on AWS-1 spectrum in Band 66 so the spectrum will be easier to deploy in those counties.

Verizon AWS-3 Capacity Expansion:
In the image below we illustrate the AWS-3 spectrum that Verizon will gain temporary access from SNR License Co and Northstar Wireless (both Dish partners). Northstar controls the AWS-3 G channel and SNR LIcense Co controls the AWS-3 H channel. In the New York market, Northstar Wireless owns the G block spectrum and SNR Wireless owns the H block spectrum. Accessing this spectrum will provide Verizon a second Band 66 LTE channel, increasing their LTE capacity from 20MHz to 30MHz.

Verizon & AT&T AWS-3 Capacity Expansion:
Verizon and AT&T have also requested access to the spectrum that Northstar Wireless and SNR Wireless returned to the FCC when their auction discounts were eliminated. The AWS-3 spectrum depth that is "unassigned" is indicated in the map below. In our data, we reflect these unassigned licenses with the FCC heading.

AT&T requested the I block spectrum in the New York market, so it will expand their Band 66 LTE from 10MHz to 15MHz. The markets AT&T requested are listed here and the markets that Verizon requested are here.

AT&T AWS-4 Capacity Expansion:
AT&T has also requested access to Dish's Band 66 spectrum. From the image above AT&T can expand their Band 66 LTE by and additional 5MHz to 20MHz by using part of Dish's AWS-4 spectrum. AT&T will still have an additional 15MHz of Dish's spectrum that they could use as an additional LTE channel in New York. AT&T only requested access to Dish's Band 66 spectrum, not their Band 70 AWS-4 spectrum.
AT&T 700MHz E-block Expansion:
Dish also reported that AT&T requested access the the 700MHz E-block in the markets that AT&T doesn't own. In the image below, Dish's ownership in Chicago and Detroit will provide AT&T the capability to expand their Band 29 supplemental downlink from 5MHz to 10MHz.

Spektrum Metrics Insights & Analytics is pleased to announce that our Millimeter Wave - Spectrum Ownership Analysis Tool has been updated with the Auction 103 results and is available for purchase.
Below is a sample of the Spectrum Grid Analysis Module, highlighting the 37/39 GHz spectrum ownership for the New York, Los Angeles, and Chicago CMA markets.

The Millimeter Wave - Spectrum Ownership Analysis Tool contains 20 additional analysis modules including:
With our Web Spectrum Viewer subscription, maps for each carrier's total Millimeter Wave spectrum depth and their spectrum depth for each frequency band are available. Below is a map for the 47GHz spectrum that Sprint won in Auction 103.
Click here to contact Spektrum Metrics Insights & Analytics.

This month, millimeter wave spectrum licenses have begun to trade again. Both USCellular and Verizon have filed to acquire multiple licenses from several carriers as depicted on the maps below:
Note: All of these licenses were held prior to Auction 101.

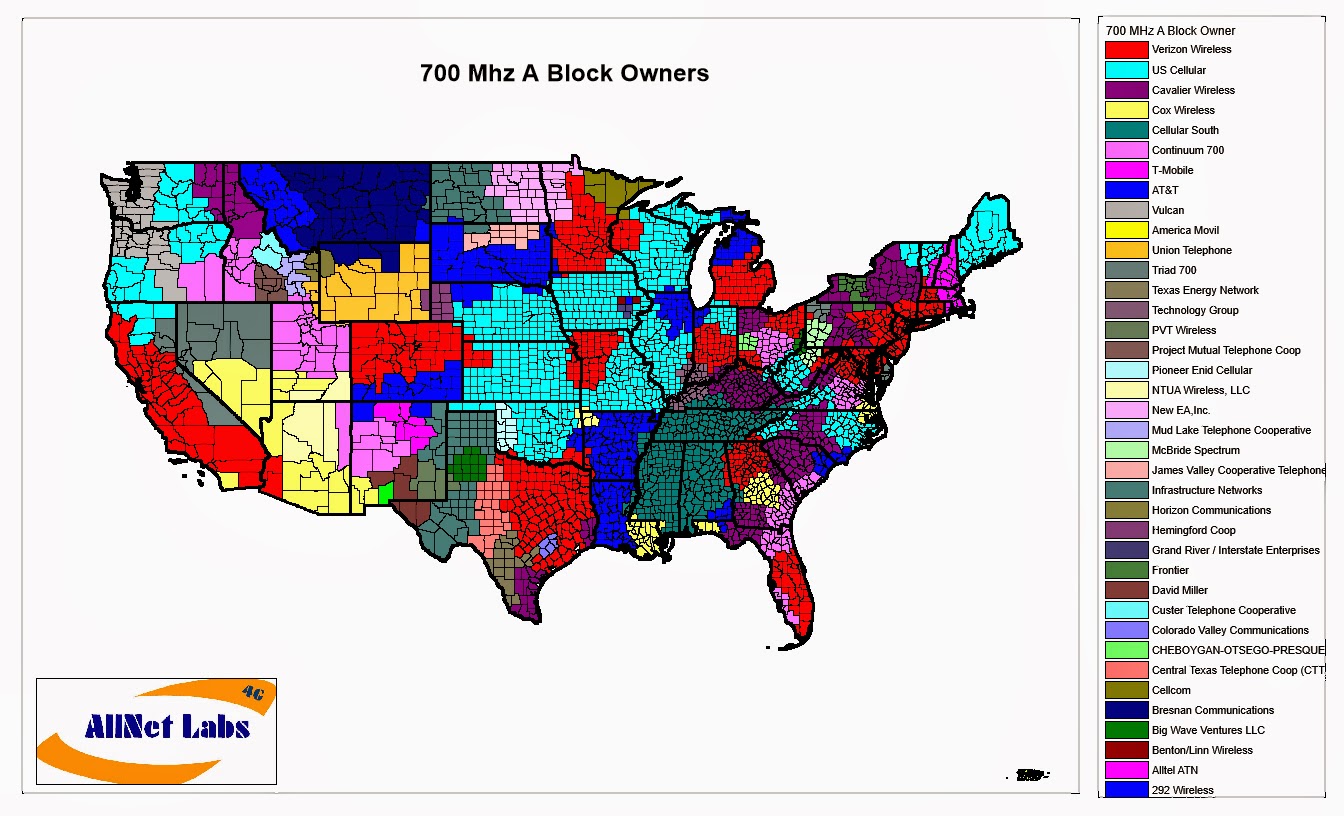
Late last year, AT&T began to discuss refarming their low-band spectrum for 5G, but they didn't indicate which of their low band spectrum blocks would be used. With some spectrum acquisitions that have been filed over the last 6 months, I believe their plans are becoming more clear. The 3 blocks of low band spectrum that AT&T controls are 700MHz (A,B, and C channels), 700MHz (FirstNet), and the Cellular (A & B channels). I am going to assume that the FirstNet spectrum is not being considered since it must support public safety networks, leaving the 700MHz and Cellular bands for refarming. The first indicator, was AT&T's acquisition of FBS 700's spectrum in South Dakota and their acquisition of part of C Spire's 700MHz spectrum in the southeast.
To see AT&T's total 700MHz spectrum, we used Allnet Insights' Mobile Carrier - Spectrum Ownership Analysis Tool to total AT&T's ownership of the 700MHz A, B, and C channels in each US county. In the counties where they own all three channels, they could deploy a 15MHz 5G channel. From the map below, it appears that AT&T would cover most of the US with a 10MHz 5G channel.

The next map highlights the counties where AT&T controls both cellular channels (A & B). In the limited markets where they control both channels (Texas and Florida), they could have a 5G channel size of 20MHz, but for most of the country that would be limited to a 10MHz 5G channel size. It is important to remember that the areas where AT&T doesn't control any cellular spectrum the bands are controlled by USCellular and/or Verizon, making cellular spectrum acquisitions unlikely.

Another important way to evaluate the usefulness of each band is to measure the amount of population that can be reach with the licenses in each band. To evaluate this we used the Licensed POPs Analysis Module from the Mobile Carrier - Spectrum Ownership Analysis Tool. Since AT&T's 700MHz spectrum covers 44 million addition people compared to AT&T's Cellular spectrum, I believe that AT&T is planning to utilize their 700MHz spectrum for their upcoming Low Band 5G deployments. This appears to be confirmed by AT&T's recent acquisitions.

Two questions for all of the wireless network installers and drive testers:
1) Where can you get the spectrum assignments for all of the mobile carrier bands with in a county?
2) How can you determine if the licensed spectrum assignment will change in the near future?
Allnet Insights' Web Spectrum Viewer now includes a Wireless Survey which details the wireless carrier that currently controls each block of Mobile Carrier spectrum (600MHz-2.5GHz) for a selected US county. In addition, the Wireless Survey indicates whether there are any filed transaction that will move that spectrum to another wireless carrier, as indicated in the Future column.
The output table details the spectrum assignments,licensees, and bandwidth for each block and is sorted from lowest frequency to highest frequency. This output table can be exported as a .csv file.


| Purpose | Assignee | Assignor | CallSign | Map | RadioService | Market | ChannelBlock |
| New Lease | Cimaron Telephone | Cross Telephone Company | WRBQ838 | AWS3 | CMA598 - Oklahoma 3 - Grant | G | |
| New Lease | GE MDS LLC | Access 700 | WPRR314 | 700MHz GB | MEA025 - Nashville | A | |
| New Lease | GE MDS LLC | Access 700 | WPRV427 | 700MHz GB | MEA008 - Atlanta | A | |
| New Lease | GE MDS LLC | Access 700 | WPRV430 | 700MHz GB | MEA024 - Birmingham | A | |
| New Lease | GE MDS LLC | Access 700 | WPRV439 | 700MHz GB | MEA038 - San Antonio | A | |
| New Lease | SpeedConnect | Sprint | B064 | Map | BRS | BTA064 - Butte, MT | BRS1 |
| New Lease | SpeedConnect | Sprint | B064 | Map | BRS | BTA064 - Butte, MT | E4 |
| New Lease | SpeedConnect | Sprint | B064 | Map | BRS | BTA064 - Butte, MT | F1 |
| New Lease | SpeedConnect | Sprint | B064 | Map | BRS | BTA064 - Butte, MT | F2 |
| New Lease | SpeedConnect | Sprint | B064 | Map | BRS | BTA064 - Butte, MT | F3 |
| New Lease | SpeedConnect | Sprint | B064 | Map | BRS | BTA064 - Butte, MT | F4 |
| New Lease | SpeedConnect | Sprint | B064 | Map | BRS | BTA064 - Butte, MT | H1 |
| New Lease | SpeedConnect | Sprint | B064 | Map | BRS | BTA064 - Butte, MT | H2 |
| New Lease | SpeedConnect | Sprint | B064 | Map | BRS | BTA064 - Butte, MT | H3 |
| New Lease | SpeedConnect | Sprint | B144 | Map | BRS | BTA144 - Flagstaff, AZ | BRS1 |
| New Lease | SpeedConnect | Sprint | B144 | Map | BRS | BTA144 - Flagstaff, AZ | E4 |
| New Lease | SpeedConnect | Sprint | B144 | Map | BRS | BTA144 - Flagstaff, AZ | F4 |
| New Lease | SpeedConnect | Sprint | B167 | Map | BRS | BTA167 - Grand Island-Kearney, NE | BRS1 |
| New Lease | SpeedConnect | Sprint | B171 | Map | BRS | BTA171 - Great Falls, MT | BRS2 |
| New Lease | SpeedConnect | Sprint | B171 | Map | BRS | BTA171 - Great Falls, MT | E1 |
| New Lease | SpeedConnect | Sprint | B171 | Map | BRS | BTA171 - Great Falls, MT | E2 |
| New Lease | SpeedConnect | Sprint | B171 | Map | BRS | BTA171 - Great Falls, MT | E3 |
| New Lease | SpeedConnect | Sprint | B171 | Map | BRS | BTA171 - Great Falls, MT | E4 |
| New Lease | SpeedConnect | Sprint | B171 | Map | BRS | BTA171 - Great Falls, MT | F1 |
| New Lease | SpeedConnect | Sprint | B171 | Map | BRS | BTA171 - Great Falls, MT | F4 |
| New Lease | SpeedConnect | Sprint | B202 | Map | BRS | BTA202 - Idaho Falls, ID | BRS1 |
| New Lease | SpeedConnect | Sprint | B202 | Map | BRS | BTA202 - Idaho Falls, ID | BRS2 |
| New Lease | SpeedConnect | Sprint | B202 | Map | BRS | BTA202 - Idaho Falls, ID | E4 |
| New Lease | SpeedConnect | Sprint | B202 | Map | BRS | BTA202 - Idaho Falls, ID | F4 |
| New Lease | SpeedConnect | Sprint | B205 | Map | BRS | BTA205 - Iowa City, IA | BRS1 |
| New Lease | SpeedConnect | Sprint | B205 | Map | BRS | BTA205 - Iowa City, IA | BRS2 |
| New Lease | SpeedConnect | Sprint | B205 | Map | BRS | BTA205 - Iowa City, IA | E4 |
| New Lease | SpeedConnect | Sprint | B205 | Map | BRS | BTA205 - Iowa City, IA | F4 |
| New Lease | SpeedConnect | Sprint | B300 | Map | BRS | BTA300 - Missoula, MT | BRS1 |
| New Lease | SpeedConnect | Sprint | B353 | Map | BRS | BTA353 - Pocatello, ID | BRS1 |
| New Lease | SpeedConnect | Sprint | B353 | Map | BRS | BTA353 - Pocatello, ID | BRS2 |
| New Lease | SpeedConnect | Sprint | B353 | Map | BRS | BTA353 - Pocatello, ID | E4 |
| New Lease | SpeedConnect | Sprint | B353 | Map | BRS | BTA353 - Pocatello, ID | F4 |
| New Lease | SpeedConnect | Sprint | B422 | Map | BRS | BTA422 - Sioux Falls, SD | BRS1 |
| New Lease | SpeedConnect | Sprint | B422 | Map | BRS | BTA422 - Sioux Falls, SD | BRS2 |
| New Lease | SpeedConnect | Sprint | B422 | Map | BRS | BTA422 - Sioux Falls, SD | E4 |
| New Lease | SpeedConnect | Sprint | B422 | Map | BRS | BTA422 - Sioux Falls, SD | F4 |
| New Lease | SpeedConnect | Sprint | B451 | Map | BRS | BTA451 - Twin Falls, ID | BRS1 |
| New Lease | SpeedConnect | Sprint | B451 | Map | BRS | BTA451 - Twin Falls, ID | E4 |
| New Lease | SpeedConnect | Sprint | B451 | Map | BRS | BTA451 - Twin Falls, ID | F4 |
| New Lease | SpeedConnect | Sprint | WFY431 | Map | BRS | P00089 - P35 GSA,40-43-38 N,99-7-41.3 W | BRS1 |
| New Lease | SpeedConnect | Sprint | WFY595 | Map | BRS | P03002 - P35 GSA,41-32-48.1 N,90-27-56.5 W | BRS1 |
| New Lease | SpeedConnect | Sprint | WGW275 | Map | BRS | P03471 - P35 GSA,43-28-24.1 N,83-50-39.9 W | E4 |
| New Lease | SpeedConnect | Sprint | WHI959 | Map | BRS | P00168 - P35 GSA,43-59-30.9 N,96-46-11.2 W | F4 |
| New Lease | SpeedConnect | Sprint | WHT588 | Map | BRS | P03685 - P35 GSA,41-31-58.1 N,90-34-40.5 W | E4 |
| New Lease | SpeedConnect | Sprint | WLK328 | Map | BRS | P01359 - P35 GSA,43-14-38 N,97-22-39.2 W | F4 |
| New Lease | SpeedConnect | Sprint | WLK384 | Map | BRS | P01362 - P35 GSA,43-14-38 N,97-22-39.2 W | E4 |
| New Lease | SpeedConnect | Sprint | WLW827 | Map | BRS | P01384 - P35 GSA,31-25-16.6 N,100-32-37.3 W | F1234 |
| New Lease | SpeedConnect | Sprint | WLW894 | Map | BRS | P01898 - P35 GSA,41-31-58.1 N,90-34-40.5 W | F4 |
| New Lease | SpeedConnect | Sprint | WMH800 | Map | BRS | P02690 - P35 GSA,34-13-58.1 N,112-22-15.6 W | E4 |
| New Lease | SpeedConnect | Sprint | WMI345 | Map | BRS | P01925 - P35 GSA,41-54-33 N,91-39-17.6 W | E4 |
| New Lease | SpeedConnect | Sprint | WMI827 | Map | BRS | P02939 - P35 GSA,34-42-17.1 N,112-6-57.6 W | E4 |
| New Lease | SpeedConnect | Sprint | WMI864 | Map | BRS | P02941 - P35 GSA,34-42-17.1 N,112-6-57.6 W | F4 |
| New Lease | SpeedConnect | Sprint | WML478 | Map | BRS | P03544 - P35 GSA,31-25-16.6 N,100-32-37.3 W | BRS1 |
| New Lease | SpeedConnect | Sprint | WMX344 | Map | BRS | P03719 - P35 GSA,43-30-10.9 N,96-34-39.2 W | F4 |
| New Lease | SpeedConnect | Sprint | WMX358 | Map | BRS | P01947 - P35 GSA,43-30-10.9 N,96-34-39.2 W | E4 |
| New Lease | SpeedConnect | Sprint | WMX656 | Map | EBS | P00155 - P35 GSA,42-43-54 N,114-25-7 W | D1234 |
| New Lease | SpeedConnect | Sprint | WMX678 | Map | EBS | P00017 - P35 GSA,42-43-54 N,114-25-7 W | C1234 |
| New Lease | SpeedConnect | Sprint | WMX908 | Map | BRS | P03551 - P35 GSA,31-25-16.6 N,100-32-37.3 W | E1234 |
| New Lease | SpeedConnect | Sprint | WNTC543 | Map | BRS | P01566 - P35 GSA,31-25-16.6 N,100-32-37.3 W | H1 |
| New Lease | SpeedConnect | Sprint | WNTC543 | Map | BRS | P01566 - P35 GSA,31-25-16.6 N,100-32-37.3 W | H2 |
| New Lease | SpeedConnect | Sprint | WQLW472 | Map | BRS | BTA070 - Cedar Rapids, IA | BRS2 |
| New Lease | SpeedConnect | Sprint | WQLW472 | Map | BRS | BTA070 - Cedar Rapids, IA | E4 |
| New Lease | SpeedConnect | Sprint | WQLW472 | Map | BRS | BTA070 - Cedar Rapids, IA | F4 |
| New Lease | SpeedConnect | Sprint | WQLW474 | Map | BRS | BTA105 - Davenport, IA-Moline, IL | BRS2 |
| New Lease | SpeedConnect | Sprint | WLW970 | Map | BRS | P02673 - P35 GSA,35-14-2 N,111-36-27.6 W | F4 |
| New Lease | SpeedConnect | Sprint | WMI320 | Map | BRS | P02694 - P35 GSA,35-14-29 N,111-36-37.6 W | E4 |
| New Lease | SpeedConnect | Sprint | B011 | Map | BRS | BTA011 - Alpena, MI | BRS1 |
| New Lease | SpeedConnect | Sprint | B011 | Map | BRS | BTA011 - Alpena, MI | E4 |
| New Lease | SpeedConnect | Sprint | B011 | Map | BRS | BTA011 - Alpena, MI | F1 |
| New Lease | SpeedConnect | Sprint | B011 | Map | BRS | BTA011 - Alpena, MI | F2 |
| New Lease | SpeedConnect | Sprint | B011 | Map | BRS | BTA011 - Alpena, MI | F3 |
| New Lease | SpeedConnect | Sprint | B011 | Map | BRS | BTA011 - Alpena, MI | F4 |
| New Lease | SpeedConnect | Sprint | B011 | Map | BRS | BTA011 - Alpena, MI | H1 |
| New Lease | SpeedConnect | Sprint | B011 | Map | BRS | BTA011 - Alpena, MI | H2 |
| New Lease | SpeedConnect | Sprint | B011 | Map | BRS | BTA011 - Alpena, MI | H3 |
| New Lease | SpeedConnect | Sprint | B307 | Map | BRS | BTA307 - Mt. Pleasant, MI | E4 |
| New Lease | SpeedConnect | Sprint | B307 | Map | BRS | BTA307 - Mt. Pleasant, MI | F4 |
| New Lease | SpeedConnect | Sprint | B390 | Map | BRS | BTA390 - Saginaw-Bay City, MI | E4 |
| New Lease | SpeedConnect | Sprint | B390 | Map | BRS | BTA390 - Saginaw-Bay City, MI | F4 |
| New Lease | T-Mobile | RigNet | WPWV330 | 700MHz | CMA306 - Gulf of Mexico | C |
In my most recent post on the filed FCC Transactions for February 2017 there were over 275 call signs that were assigned to new licensees and nearly 100 call signs that were leased. In an industry driven by spectrum, these changes affect the operations for every wireless carrier, they change site interference, and they affect the channels that are programmed into private repeaters and DAS systems.
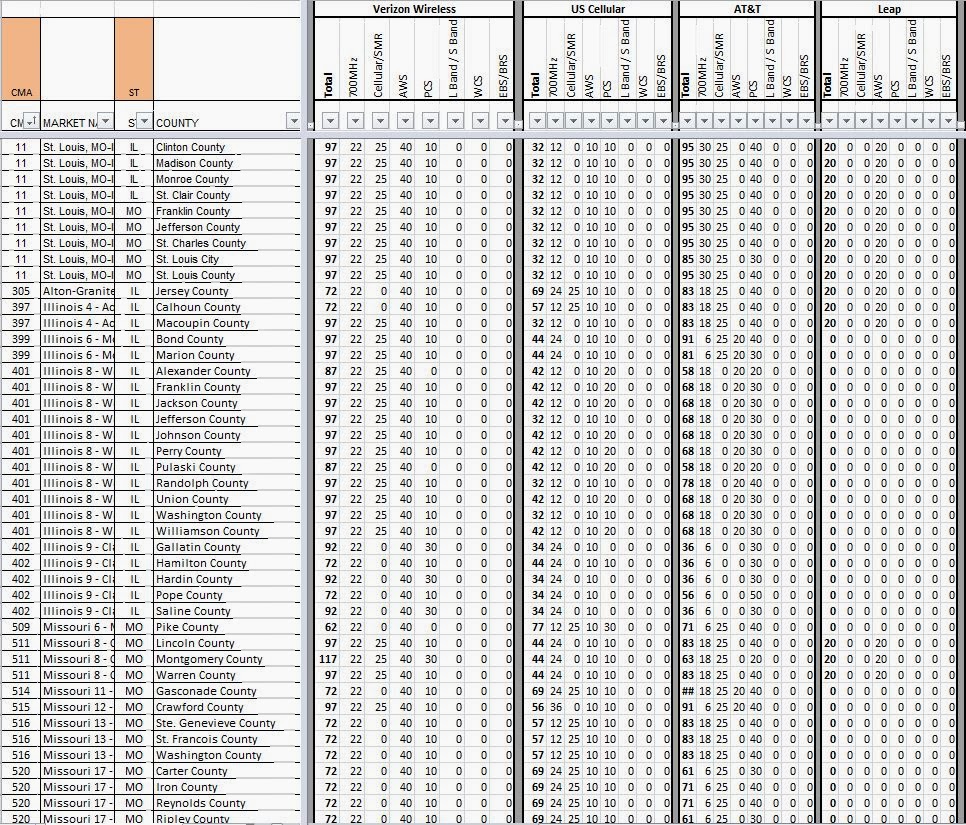
So how can your company stay on top of the changes that may affect your markets. Allnet Insights' publishes a National Carrier Spectrum Depth Report which details the spectrum held by Verizon, AT&T, T-Mobile, Sprint, Dish, and USCellular in the Top 100 Cellular Market Areas (CMA). We report both the spectrum that each carrier currently holds (Current Holdings) and the spectrum they will hold in the future (Future Holdings) based on pending FCC transactions. Reporting on both current and future holdings enables Allnet Insights' to also report on the changes between current and future holdings which highlight the location and quantity of spectrum that is changing hands.
Below is a screenshot of the 11th through the 25th most populated CMA markets in our February 2017 report. This highlights the markets where the national carriers are either increasing or decreasing their spectrum holdings. In the Excel report you can reveal specific holdings by frequency bands that are changing but for this post, we will stay with the total spectrum view. From this view, you can see that in San Diego, T-Mobile is increasing their held spectrum by 5MHz while AT&T is decreasing their held spectrum by 5MHz. The reverse is happening in the Sacramento CMA.

We also highlight the spectrum that is changing hands in our Web Spectrum Viewer. In the Spectrum Grid menu, we lower case the 3 letter carrier code to indicate that the carrier ownership is changing from the current to the future. Looking at the same San Diego market (San Diego County) you can see (tmo) on the PCS B6 spectrum. Since this screen shot is of the Future Holdings, T-Mobile is will control this spectrum in the future.
Future:

The screen shot below is of the San Diego County Current Holdings. (att) in the PCS B6 column indicates that AT&T is the current operator of the B6 channel.
Current:

For Sacramento (Placer, Sacramento, and Yolo Counties), we can see that AT&T will be the future operator of the PCS B11 channel and that T-Mobile will be the carrier giving up the PCS B11 channel.
Future:

Current:

My last example is in Tucson, AZ. From the National Carriers Report we can see that T-Mobile is increasing their held spectrum by 10MHz.

From the Web Spectrum Viewer, it is clear that T-Mobile is receiving the PCS A10 and A11 channels from Commnet (cmm).
Future:

Current:

Today, we have released Allnet's Insights' March 2017 Mobile Carrier - Spectrum Ownership Analysis Tool. Below are the transactions that have been updated by the FCC from February 1st to February 28th and are included in our update.
The details for all of the below transactions are available by subscribing to Allnet Insights' Web Tool - Basic Module. Our Web Tool provides spectrum transaction detail, a spectrum grid of spectrum owners at a county level, and spectrum database covering all mobile carrier frequencies from 600MHz to 2.5 GHz.
Granted Assignments (Assigning Ownership from Assignor to Assignee):


Granted Leases (Leased to Assignee from Assignor):


New Pending Assignments (Assigning Ownership from Assignor to Assignee):

Pending Leases (Leased to Assignee from Assignor):

Today, we have released Allnet's Insights' January 2017 Mobile Carrier - Spectrum Ownership Analysis Tool. Below are the transactions that have been updated by the FCC from December 1 to December 31 and are included in our update.
The details for all of the below transactions are available by subscribing to Allnet Insights' Web Tool - Basic Module. Our Web Tool provides spectrum transaction detail, a spectrum grid of spectrum owners at a county level, and spectrum database covering all mobile carrier frequencies from 700MHz to 2.5 GHz.
Granted Assignments (Assigning Ownership from Assignor to Assignee):


Granted Leases (Leased to Assignee from Assignor):

New Pending Assignments (Assigning Ownership from Assignor to Assignee):

Pending Leases (Leased to Assignee from Assignor):

With this blog post, we are highlighting the Change in Spectrum Holdings feature of our National Carriers - Spectrum Holdings reports. In this report, we detail the spectrum holdings for each of the national carriers, including Dish, and USCellular. The first segment of the report details each carrier's future holdings, tracking the effects of all pending FCC transactions. The second segment of the report details each carrier's current spectrum holdings. Using each of these segments, we provide a Change in Spectrum Holdings segment which highlights the CMA markets where a carrier's spectrum holding are increasing (+) or decreasing (-) because of filed FCC transactions.

In the view above, from August 2016, you can see the summary details for the spectrum additions and subtractions for each of the national wireless carriers. This view highlights a spectrum trade between Sprint and T-Mobile in the Cleveland market (5 MHz) as well as the T-Mobile's pending 700MHz A-Block transactions.
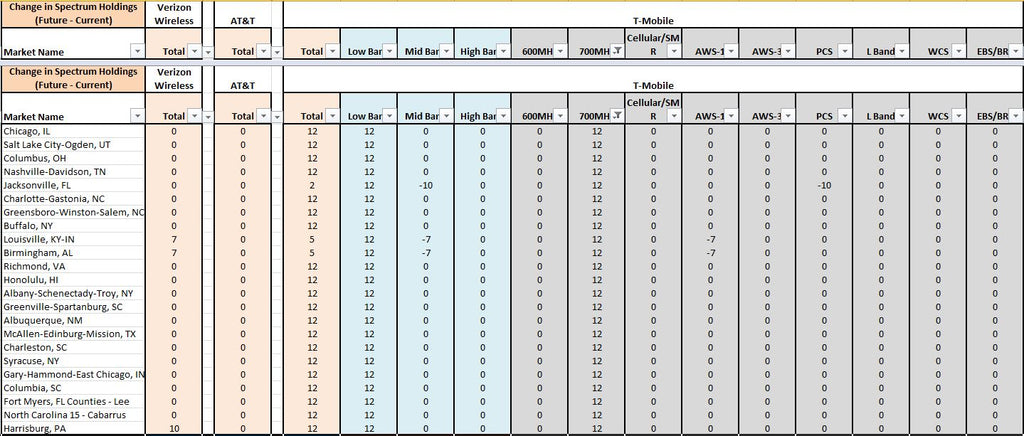
The view above details the band classifications (low, mid, or high) and the frequency band that contribute to T-Mobile's 12 MHz increase in spectrum. The August 2016 report concludes that the transactions for all of the listed market names are still pending.
Now looking at the September 2016, the Allnet's Spectrum Ownership Analysis Tool has updated the transactions that were consummated during August 2016. The only pending 700MHz - A Block transaction is T-Mobile's purchase of Laser in Chicago, IL.
For the cost of a monthly subscription to the National Carrier - Spectrum Depth Reports ($495/mo), the monthly effect of pending and closed transaction can be seen and evaluated.

email us at: info@allnetinsights.com to request a copy of the above map
Our most recent posts have looked at the low band spectrum that T-Mobile is accumulating, the 700 MHz A-Block. To see the low band spectrum that AT&T has typically deployed for LTE, we need to look at the 700 MHz B-block and 700 MHz C-block. With the B-block spectrum, it is clear that AT&T is visually the dominant spectrum holder. When looking at the licensed population data, this is true as well.

AT&T dominates the licensed population (POPS) numbers as well, accounting for 274 million of the 312 million US States and Territories population. These population numbers relate to the 2010 Census. C Spire with 1.4 million licensed POPS and US Cellular (23 million) both have significant spectrum in their regional operations area with the 700 MHz B Block spectrum.
 email us at: info@allnetinsights.com to request a copy of the above map
With the C-block spectrum, AT&T dominates the west coast and southeast but gives way to USCellular and other regional operators in the midwest.

Looking at the licensed population numbers, AT&T has about 15 million more licensed POPS with their C block spectrum than their B block spectrum. While USCellular has significantly less C block spectrum (6.8 million POPS compared to 22 million POPS). It is also apparent that T-Mobile has very limited ownership of B-block spectrum (262,000 POPS) and C-block spectrum (119,000 POPS). Clearly AT&T has the ability to combine their B and C block channels in many markets to create a 10x10 LTE channel. We will include a map in a future blog detailing AT&T's total 700 MHz (A/B/C) spectrum holdings as well as USCellular's total 700 MHz (A/B/C) spectrum holdings.


These graphs detail the peak capacity for downlink files and streaming video for the four major national wireless carriers plus Dish and USCellular. They illustrate the peak capacity on a market-by-market basis. In creating the graphs, I anticipate the usage of each wireless carrier’s total spectrum available, not just the spectrum they have dedicated to LTE at this time. These graphs allow you to see the significant capacity advantage that Sprint will have once they deploy their 2.5GHz spectrum. They also provide a market-by-market comparison of AT&T and Verizon capacity. You can see that AT&T has a capacity advantage versus Verizon in all Top 20 markets except Minneapolis-St. Paul. In addition, you can see the relatively low capacity that T-Mobile is able to offer and the capacity that Dish could provide after they launch a network.
I was able to construct these graphs by using Allnet Insights and Analytics Spectrum Ownership Analysis Tool determine the number of LTE channels that each carrier’s spectrum can support.
Assuming that each LTE channel had the follow achievable LTE Peak Data Rates:

These rates were applied to each of the carriers LTE channels to create a total peak downlink throughput. For all EBS/BRS spectrum (Sprint’s 2.5GHz spectrum), I assumed TDD (Time Division Duplex) LTE operation and each channel’s throughput was reduced to 75% to reflect the 75:25 downlink to uplink ratio for TDD operation. TDD LTE utilizes a single radio channel to both transmit to the mobile device (downlink) and transmit from the mobile device (uplink). In TDD LTE timeslots, similar to the wedges on the Wheel of Fortune, carry either downlink traffic or uplink traffic during that time interval. Since internet traffic is typically 75% downlink and 25% uplink, US operators dedicate 75% of the wedges to downlink and 25% to uplink. Most US spectrum bands are configured for FDD (Frequency Division Duplex) LTE, which utilizes two radio channels, one to transmit to the mobile device (downlink), and one to transmit from the mobile device (uplink).